Fig. 3.
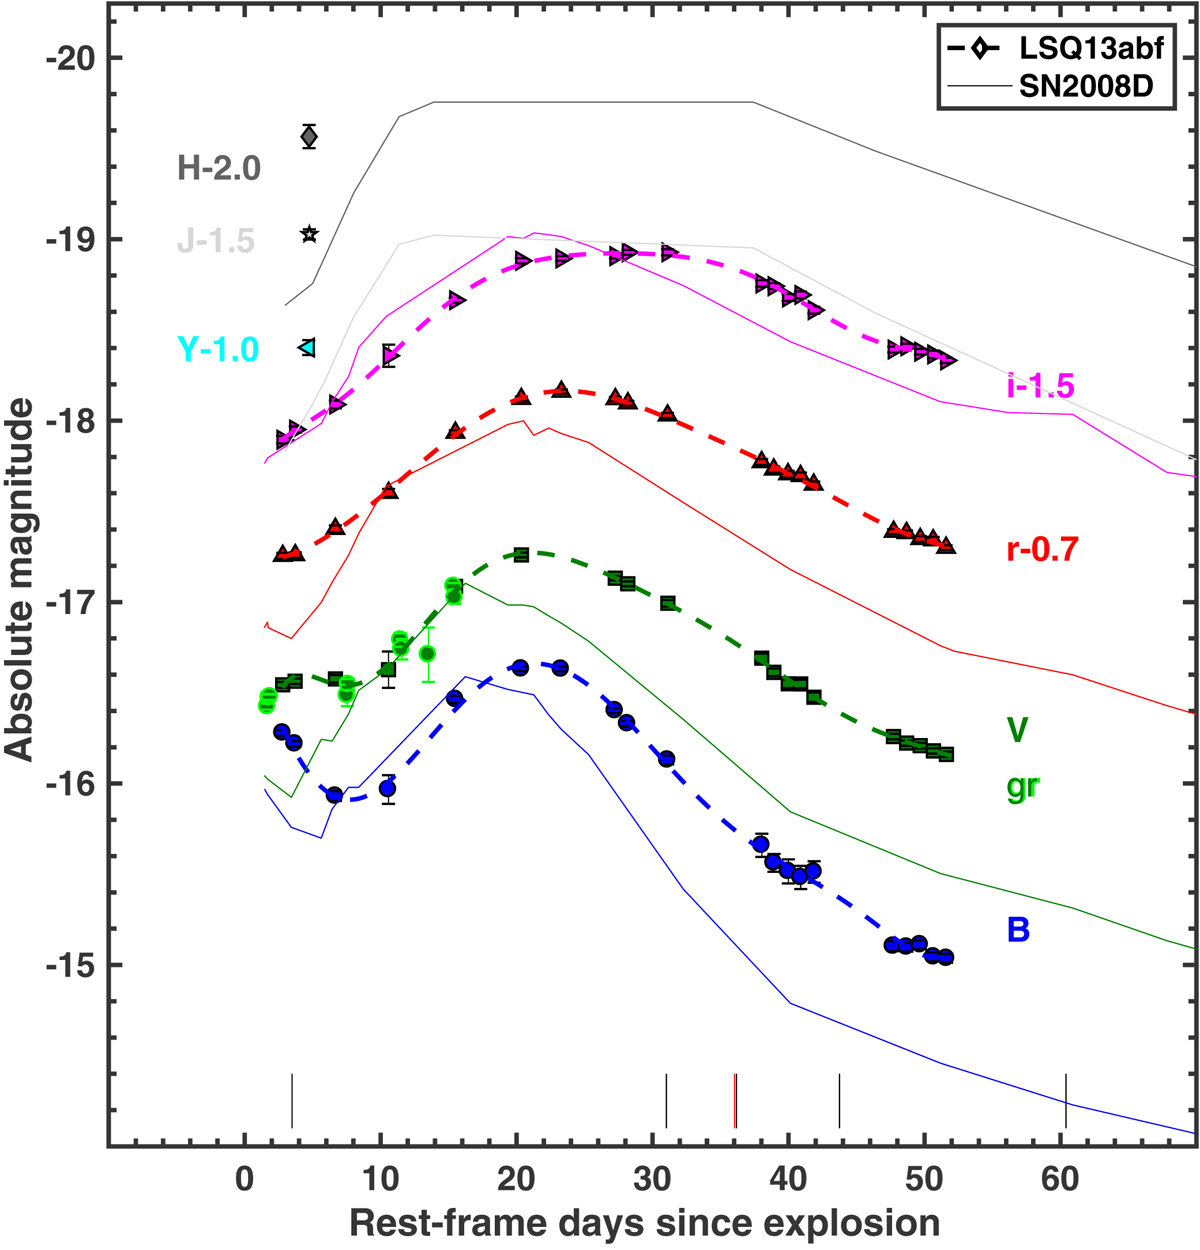
Absolute-magnitude light curves of LSQ13abf. Each light curve has been shifted by different amounts in magnitude (reported next to the name of each filter) for visual clarity. The optical light curves were fit with a low-order polynomial marked by dashed, thick lines of the same color of each light curve. The BVri light curves peak at +21.3, +21.1, +23.6, +27.6 d, respectively. The optical(NIR) spectral epochs are marked by black(red) segments at the bottom of the figure. We also report the corresponding absolute magnitudes of SN 2008D (Malesani et al. 2009) as solid colored lines, shifted by the same amounts used for LSQ13abf. The two SNe are remarkably similar when put into context with the light curve diversity among SE SN as shown in Fig. 5 of this paper.
Current usage metrics show cumulative count of Article Views (full-text article views including HTML views, PDF and ePub downloads, according to the available data) and Abstracts Views on Vision4Press platform.
Data correspond to usage on the plateform after 2015. The current usage metrics is available 48-96 hours after online publication and is updated daily on week days.
Initial download of the metrics may take a while.