Free Access
Fig. 14.
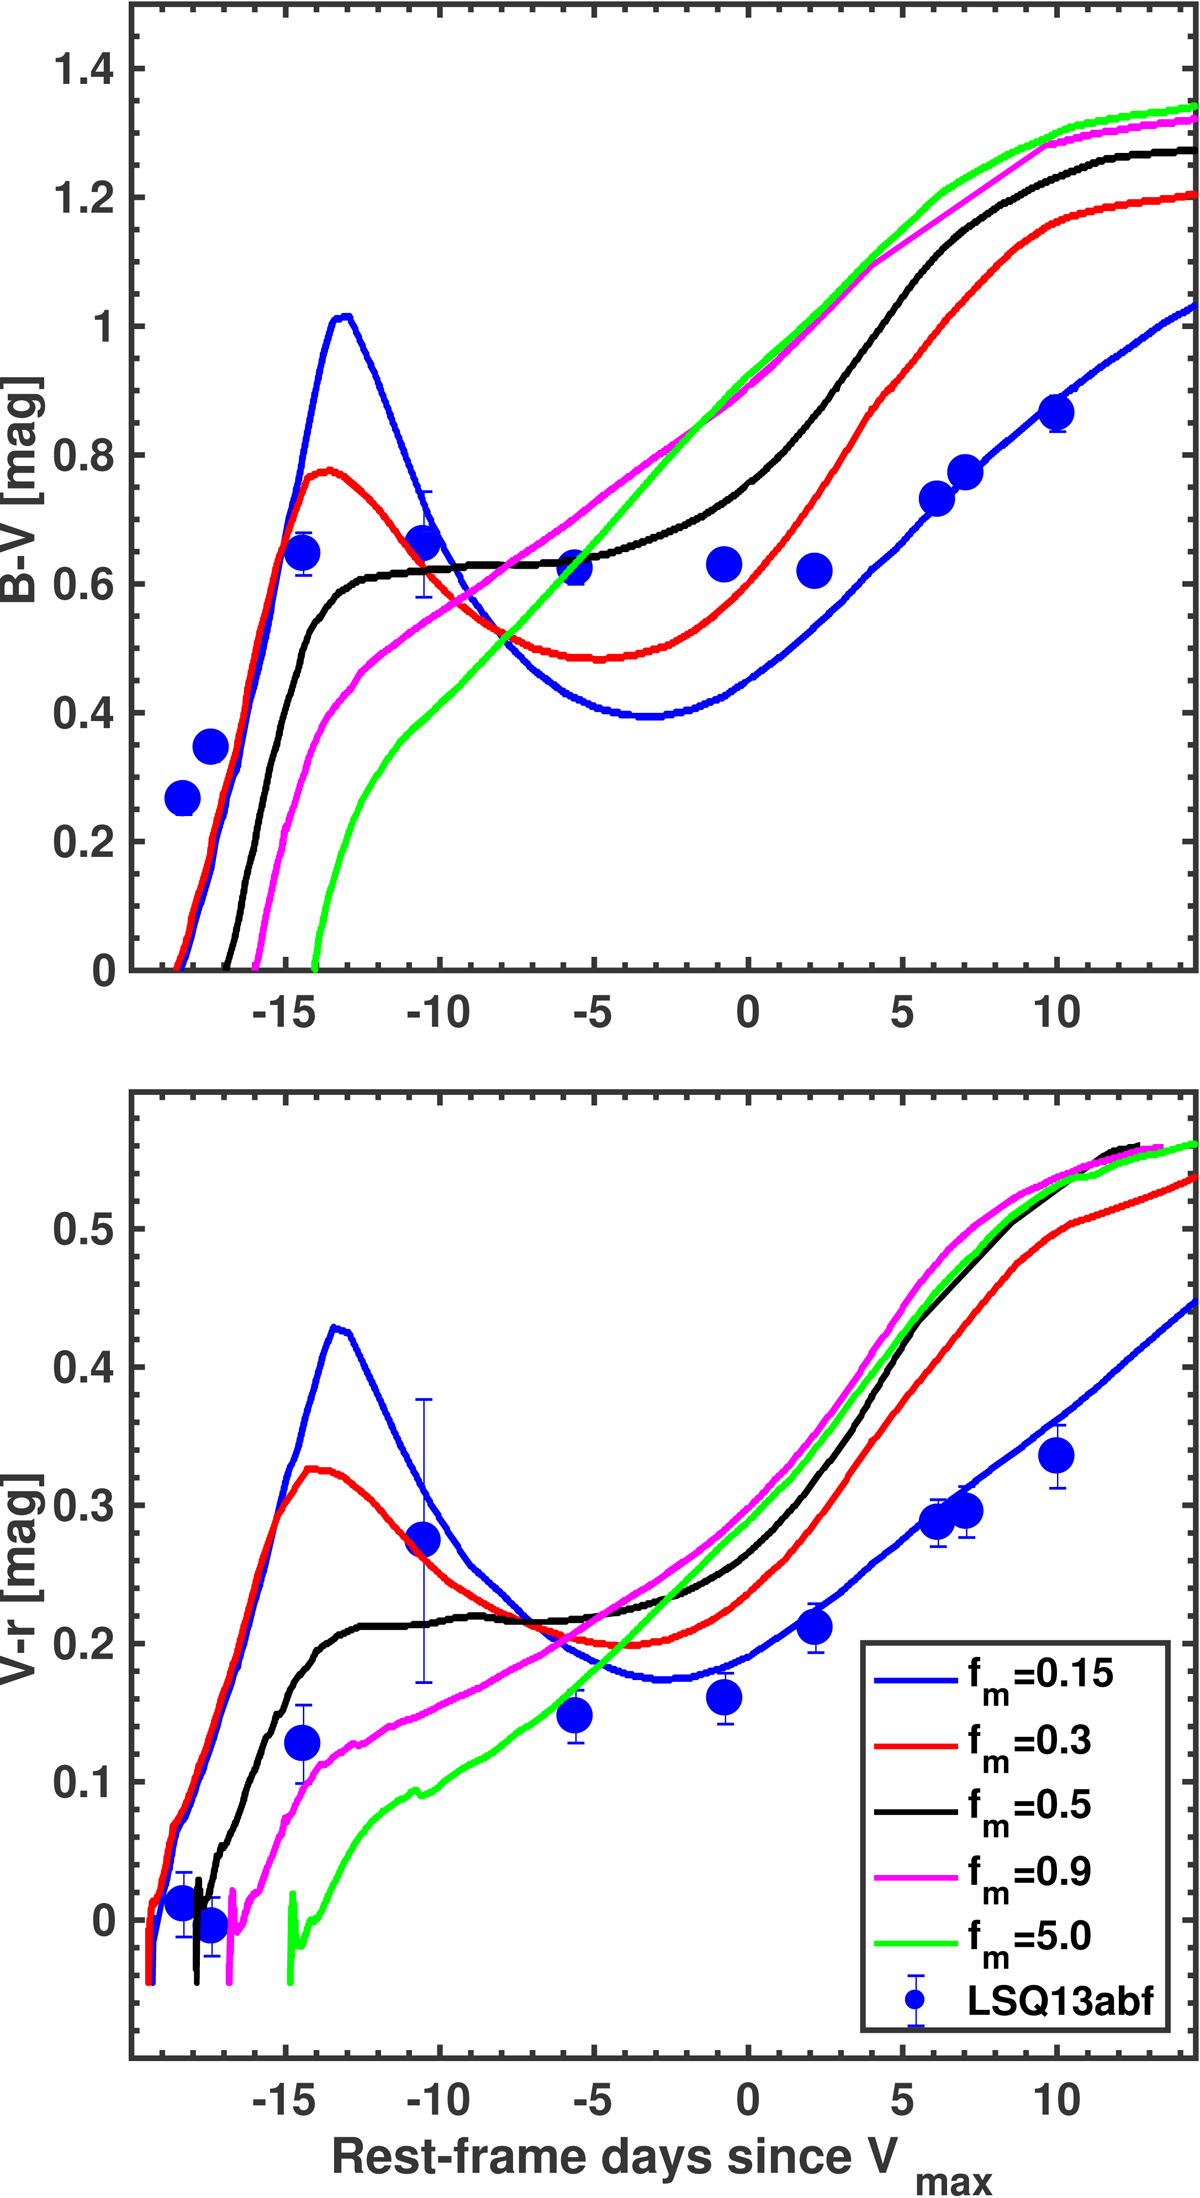
(B − V) and (V − R) color-curve evolution of LSQ13abf compared to the synthetric color-curve evolution of five SN Ib models presented by Yoon et al. (2019) covering various degrees of 56Ni mixing (fm). The comparison suggests LSQ13abf experienced a low amount of 56Ni mixing, that is fm ∼ 0.15 − 0.3.
Current usage metrics show cumulative count of Article Views (full-text article views including HTML views, PDF and ePub downloads, according to the available data) and Abstracts Views on Vision4Press platform.
Data correspond to usage on the plateform after 2015. The current usage metrics is available 48-96 hours after online publication and is updated daily on week days.
Initial download of the metrics may take a while.