Fig. 10.
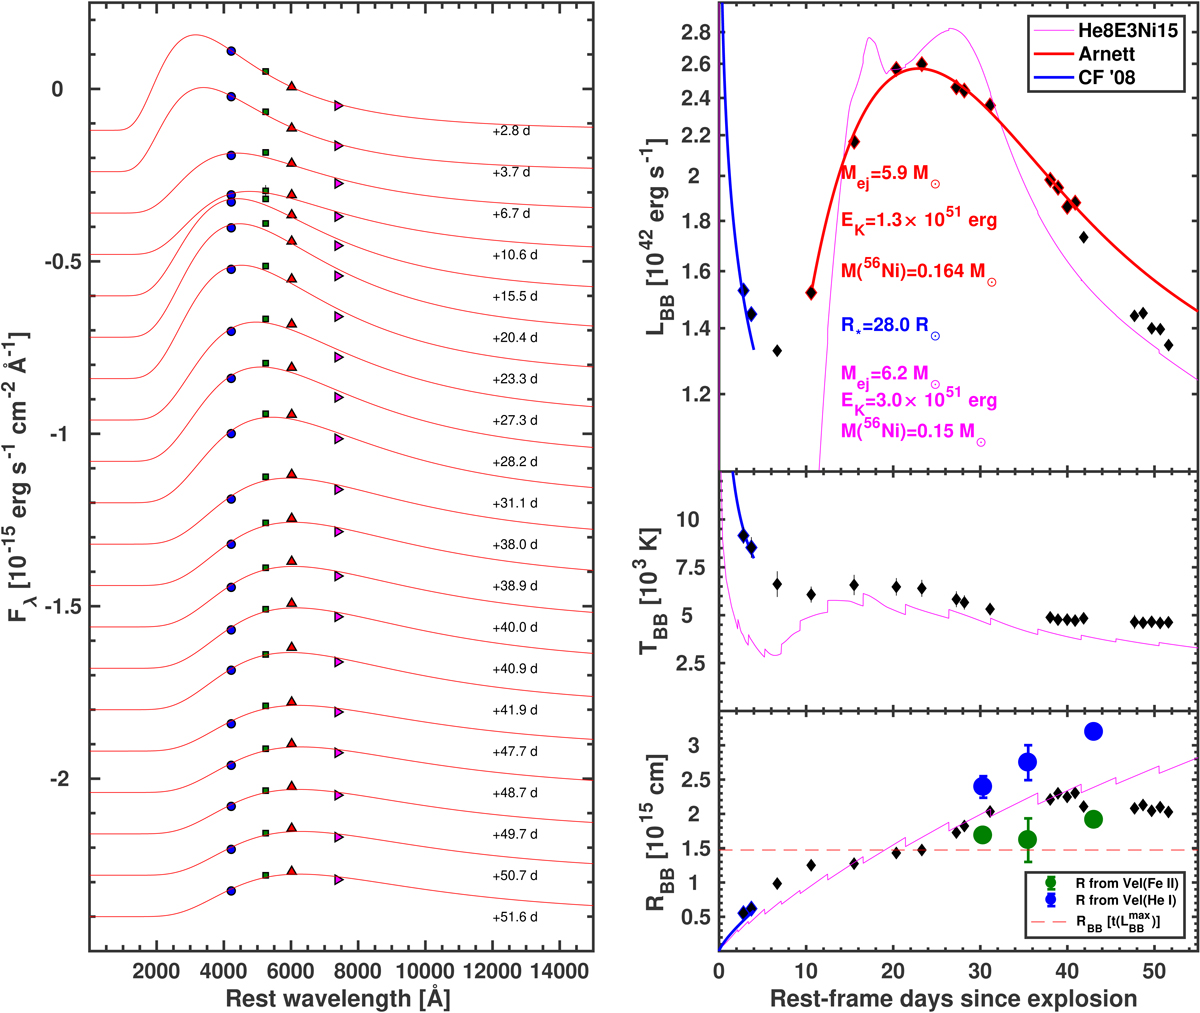
Left: spectral energy distributions (SEDs) of LSQ13abf based on Bgri photometry. The SEDs have been shifted by the addition of an arbitrary constant for clarity and phases relative to the explosion epoch are reported. The symbols for the filters are as in Fig. 3. Each SED is fit with a BB function (red solid line) providing estimates of (right, top) the total luminosity (LBB), (right, middle) the BB temperature (TBB), and (right, bottom) the BB radius (RBB). The early cooling phase is clearly visible with a prompt drop in the TBB. Right: top panel, LBB is fit with an Arnett model (solid red line), beginning from the fourth epoch post discovery when the process(es) producing the early peak is negligible. To perform the Arnett model fit, a peak velocity derived from the RBB at the time of Lmax (red dashed line in the bottom panel) was adopted. This BB velocity at peak was then reduced by ≈18%, which is the difference between the RBB and the photospheric radius (green dots) derived at later epochs from the Fe II velocity. The first two measurements of LBB, TBB, and RBB were also simultaneously fit with the post-shock breakout cooling model of Chevalier & Fransson (2008, blue line). The corresponding explosion parameters derived from the combined model are reported in the top-panel. Shown in magenta for comparison are the bolometric properties of a hydrodynamical model from Taddia et al. (2018b).
Current usage metrics show cumulative count of Article Views (full-text article views including HTML views, PDF and ePub downloads, according to the available data) and Abstracts Views on Vision4Press platform.
Data correspond to usage on the plateform after 2015. The current usage metrics is available 48-96 hours after online publication and is updated daily on week days.
Initial download of the metrics may take a while.