Fig. 1.
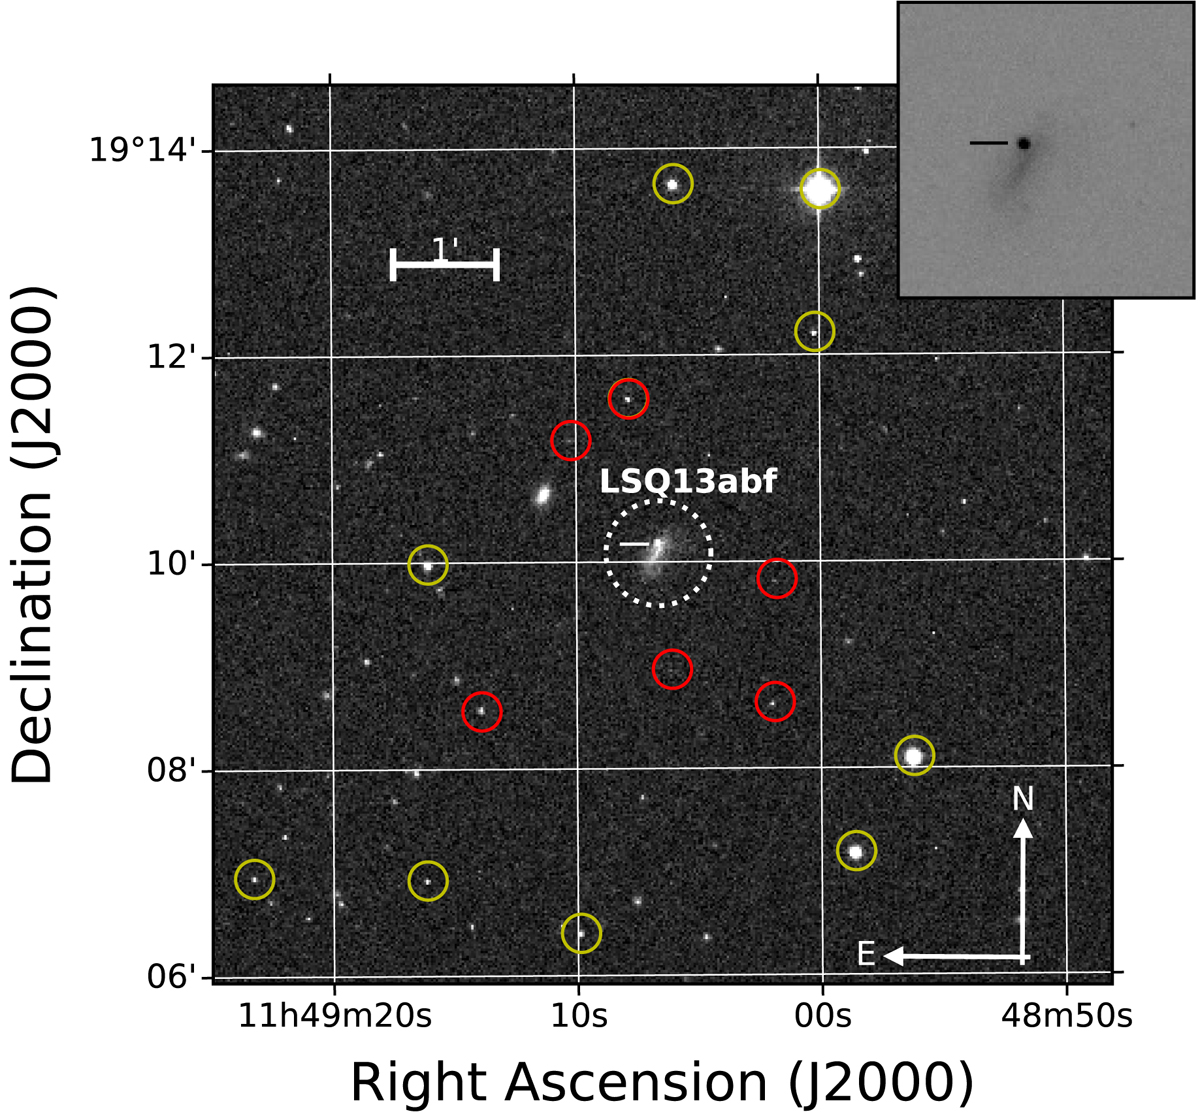
Finding chart of LSQ13abf constructed using a single r-band image obtained with the Swope 1 m telescope when the supernova was at peak brightness. The position of the SN (dotted circle) is shown within the inset in the upper right corner of the figure, and the optical (yellow circles) and NIR (red circles) local sequences are indicated.
Current usage metrics show cumulative count of Article Views (full-text article views including HTML views, PDF and ePub downloads, according to the available data) and Abstracts Views on Vision4Press platform.
Data correspond to usage on the plateform after 2015. The current usage metrics is available 48-96 hours after online publication and is updated daily on week days.
Initial download of the metrics may take a while.