Fig. 7.
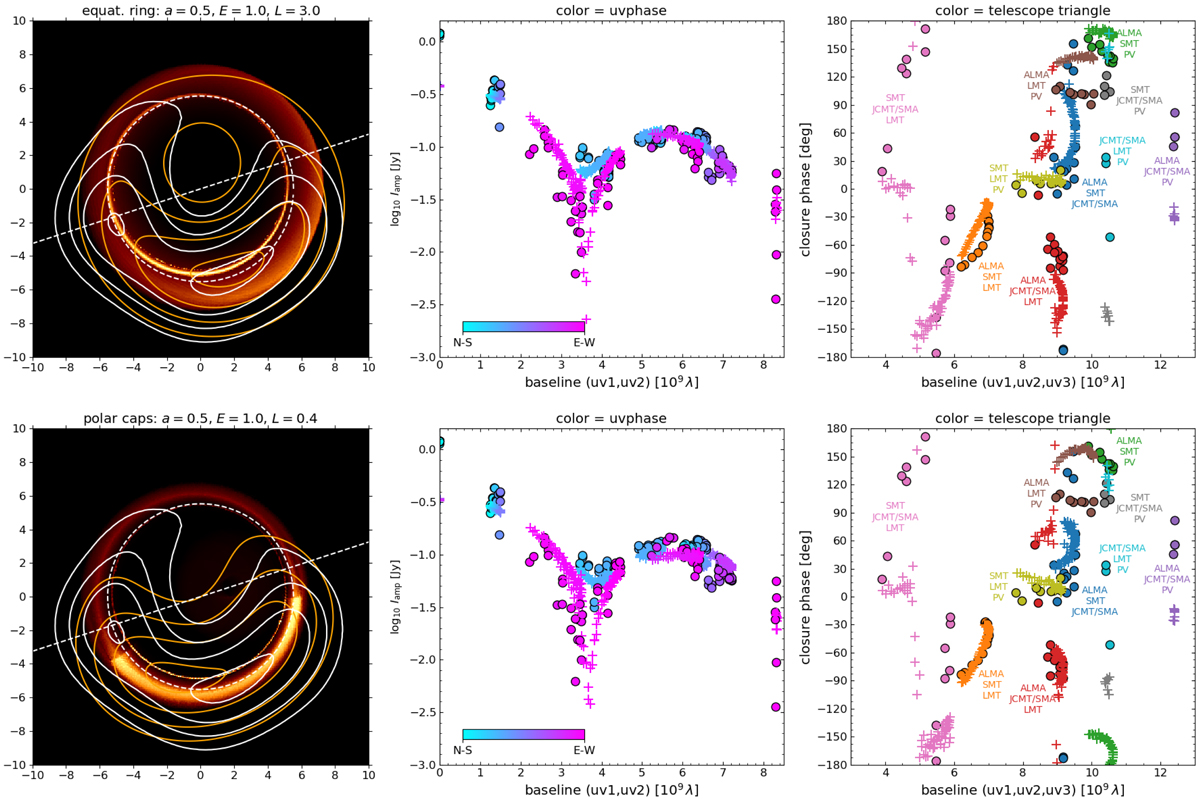
Results of simulated EHT observations of selected model images. Left panels: model images (high resolution in colour scale and EHT resolution with the orange contours) compared with the reference image reconstructed from the actual EHT observations of M 87* obtained on 2017 April 11 (solid white contours). Middle panels: visibility amplitude as a function of telescope pair baseline. The filled circles indicate the actual EHT measurements of M 87*, and the crosses indicate the simulated EHT observations of the model image. The symbol colour indicates the orientation of the telescope pair baseline. Right panels: closure phase as a function of telescope triangle baseline. The symbol colour indicates the telescope triangle indicated by the labels.
Current usage metrics show cumulative count of Article Views (full-text article views including HTML views, PDF and ePub downloads, according to the available data) and Abstracts Views on Vision4Press platform.
Data correspond to usage on the plateform after 2015. The current usage metrics is available 48-96 hours after online publication and is updated daily on week days.
Initial download of the metrics may take a while.