Fig. 9.
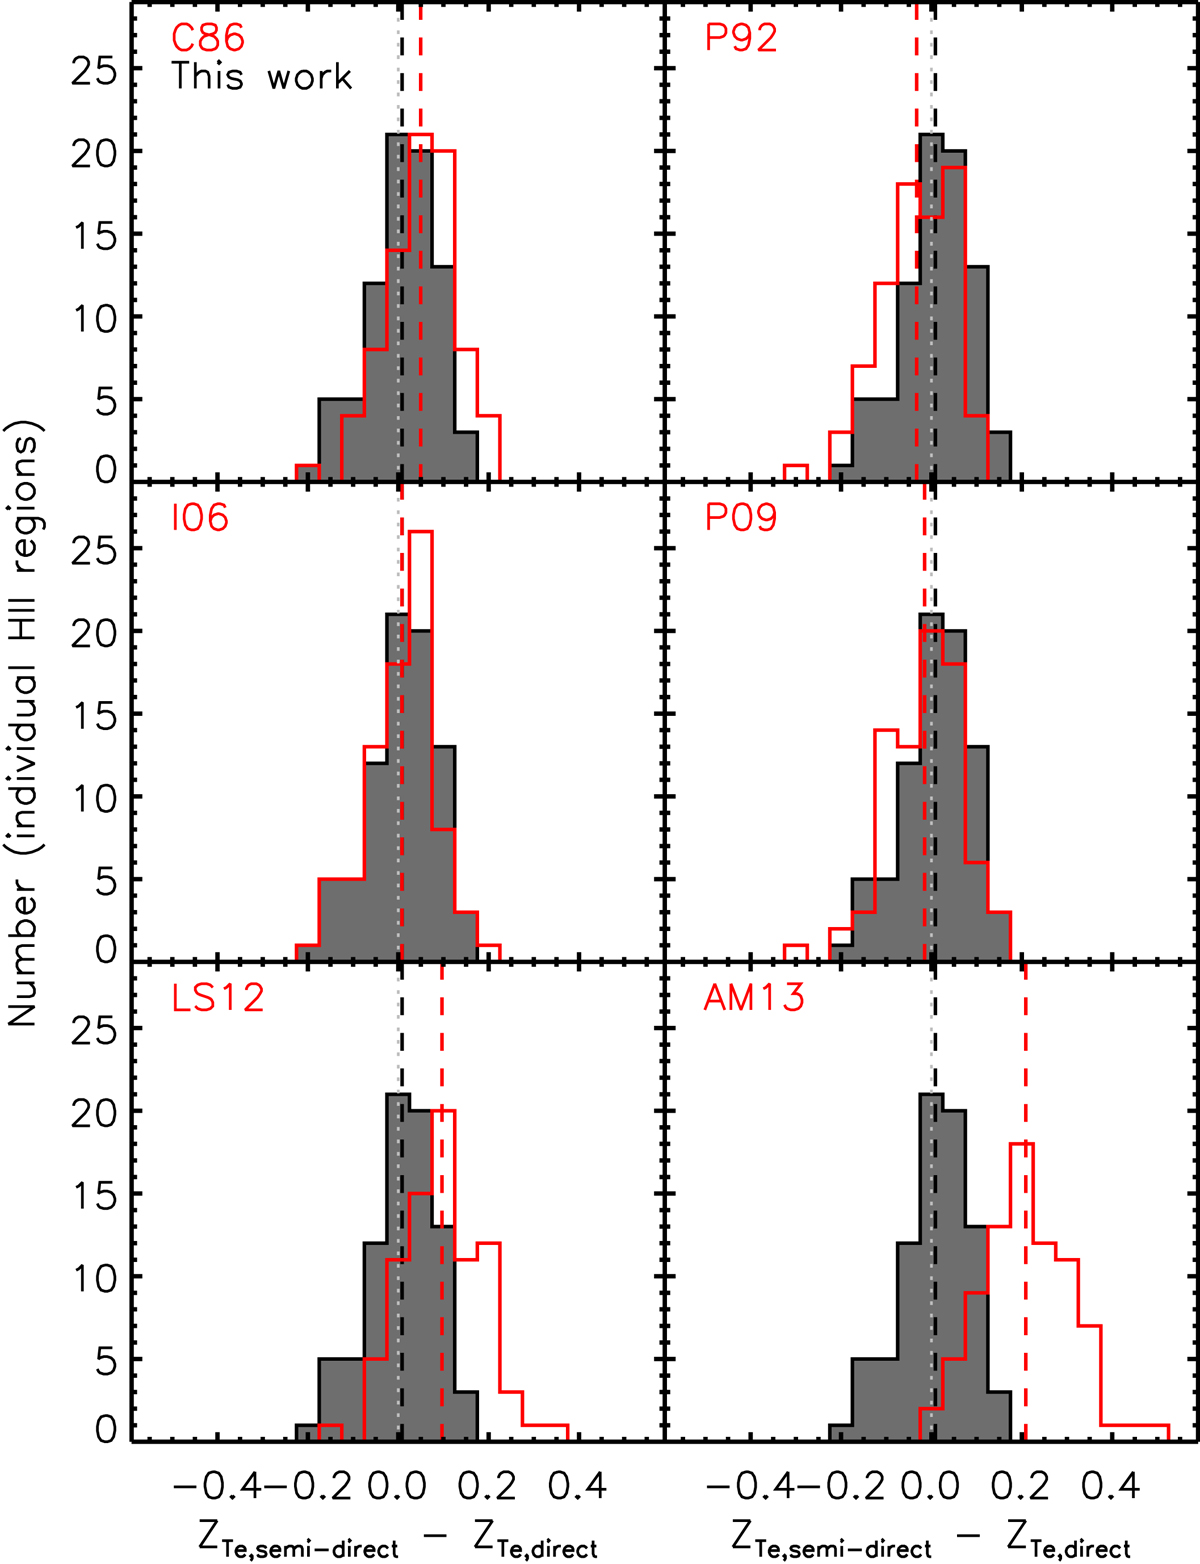
Distribution of ZTe discrepancies for individual HII regions (as defined in Sect. 5.2.4) when using each of the six literature Te(OIII)–Te(OII) relations considered (red histograms). The distribution for our new semi-direct method (dark grey historgram) when corrected for the observed O++/O+ bias (Eq. (12)) is also shown in each panel. The mean of each distribution is shown as a vertical dashed line.
Current usage metrics show cumulative count of Article Views (full-text article views including HTML views, PDF and ePub downloads, according to the available data) and Abstracts Views on Vision4Press platform.
Data correspond to usage on the plateform after 2015. The current usage metrics is available 48-96 hours after online publication and is updated daily on week days.
Initial download of the metrics may take a while.