Fig. 7.
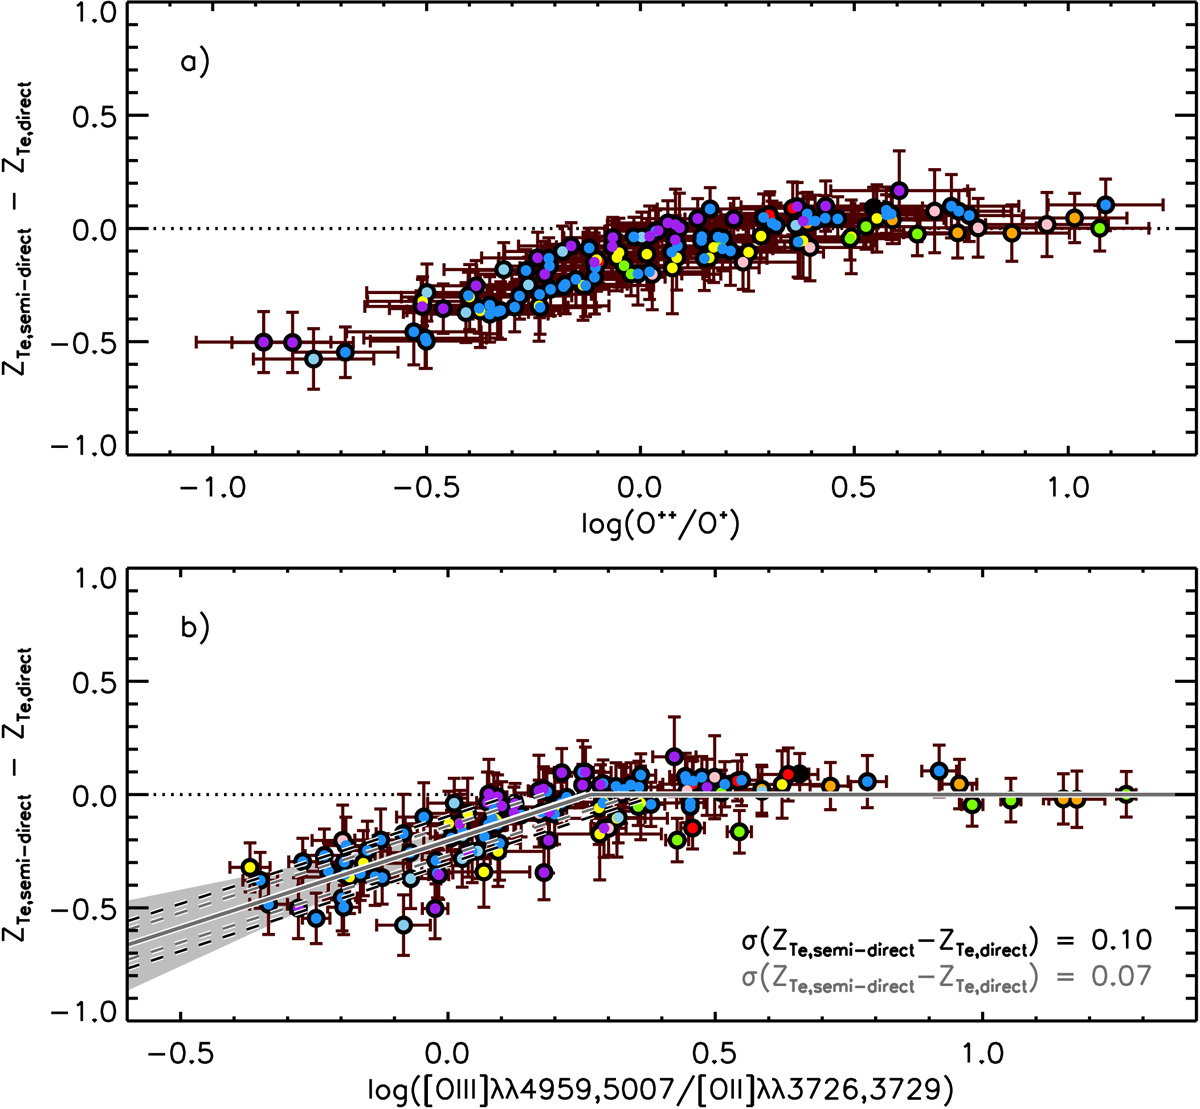
Panel a: semi-direct ZTe deficit (as defined in Sect. 5.2) as a function of O++/O+. There is a tight anti-correlation between these two properties at low values of O++/O+. Panel b: semi-direct ZTe deficit as a function of the nebular line ratio [OIII]/[OII]. As in Fig. 4, the Bayesian fit to this relation is given by the solid dark grey line, and the least-squares fit is given by the solid black line. These fits can be used to help correct semi-direct ZTe estimates for the O++/O+ bias seen in panela.
Current usage metrics show cumulative count of Article Views (full-text article views including HTML views, PDF and ePub downloads, according to the available data) and Abstracts Views on Vision4Press platform.
Data correspond to usage on the plateform after 2015. The current usage metrics is available 48-96 hours after online publication and is updated daily on week days.
Initial download of the metrics may take a while.