Fig. 4.
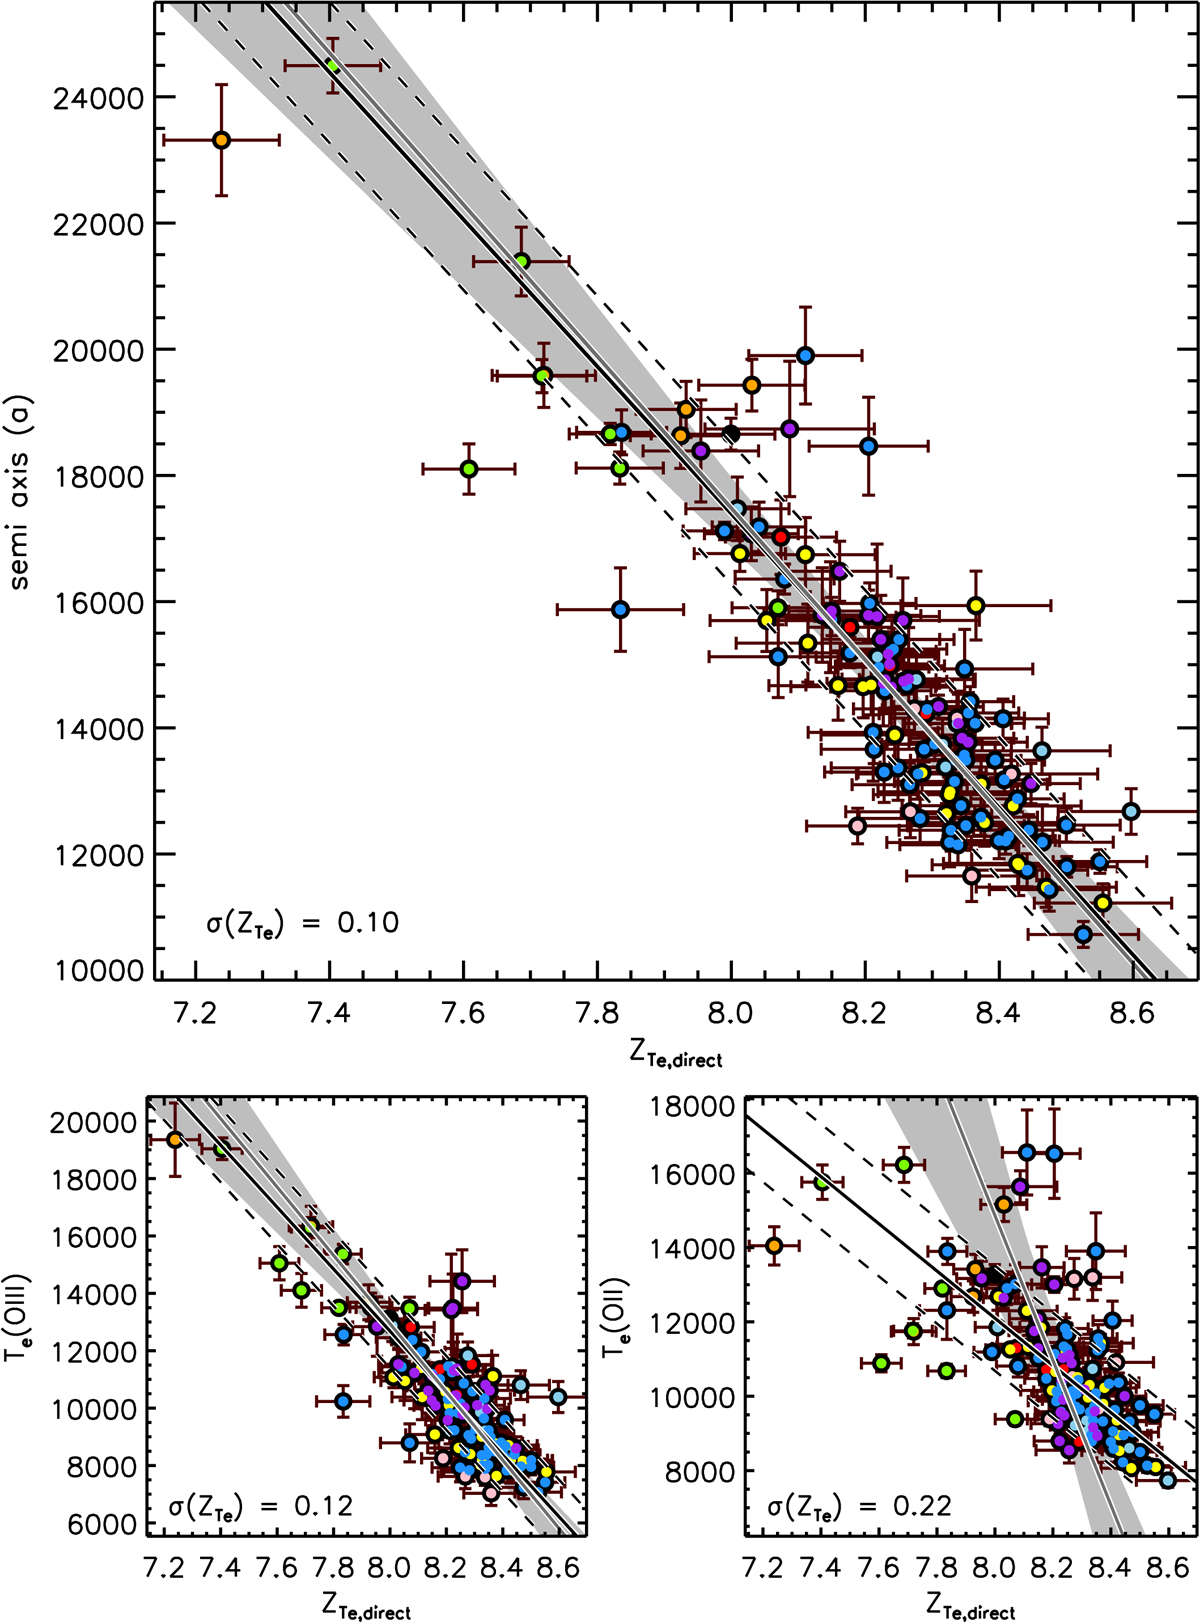
Top panel: relation between ZTe and the hyperbolic semi-axis a for our direct dataset. Linear fits to the data (Eq. (10)) are shown for our Bayesian analysis (dark grey solid line) and least squares fitting (black solid line). Dashed lines indicate the 1σ scatter around the distribution of ZTe values for the least-squares fit. The grey area around the Bayesian best-fit indicates the range of possible fits considering the full covariance matrix. Bottom panels: ZTe − Te(OIII) and ZTe–Te(OII) relations for the same dataset. The large spread in the ZTe − Te(OII) relation leads to quite discrepant fits being returned by our two statistical fitting methods.
Current usage metrics show cumulative count of Article Views (full-text article views including HTML views, PDF and ePub downloads, according to the available data) and Abstracts Views on Vision4Press platform.
Data correspond to usage on the plateform after 2015. The current usage metrics is available 48-96 hours after online publication and is updated daily on week days.
Initial download of the metrics may take a while.