Fig. 3.
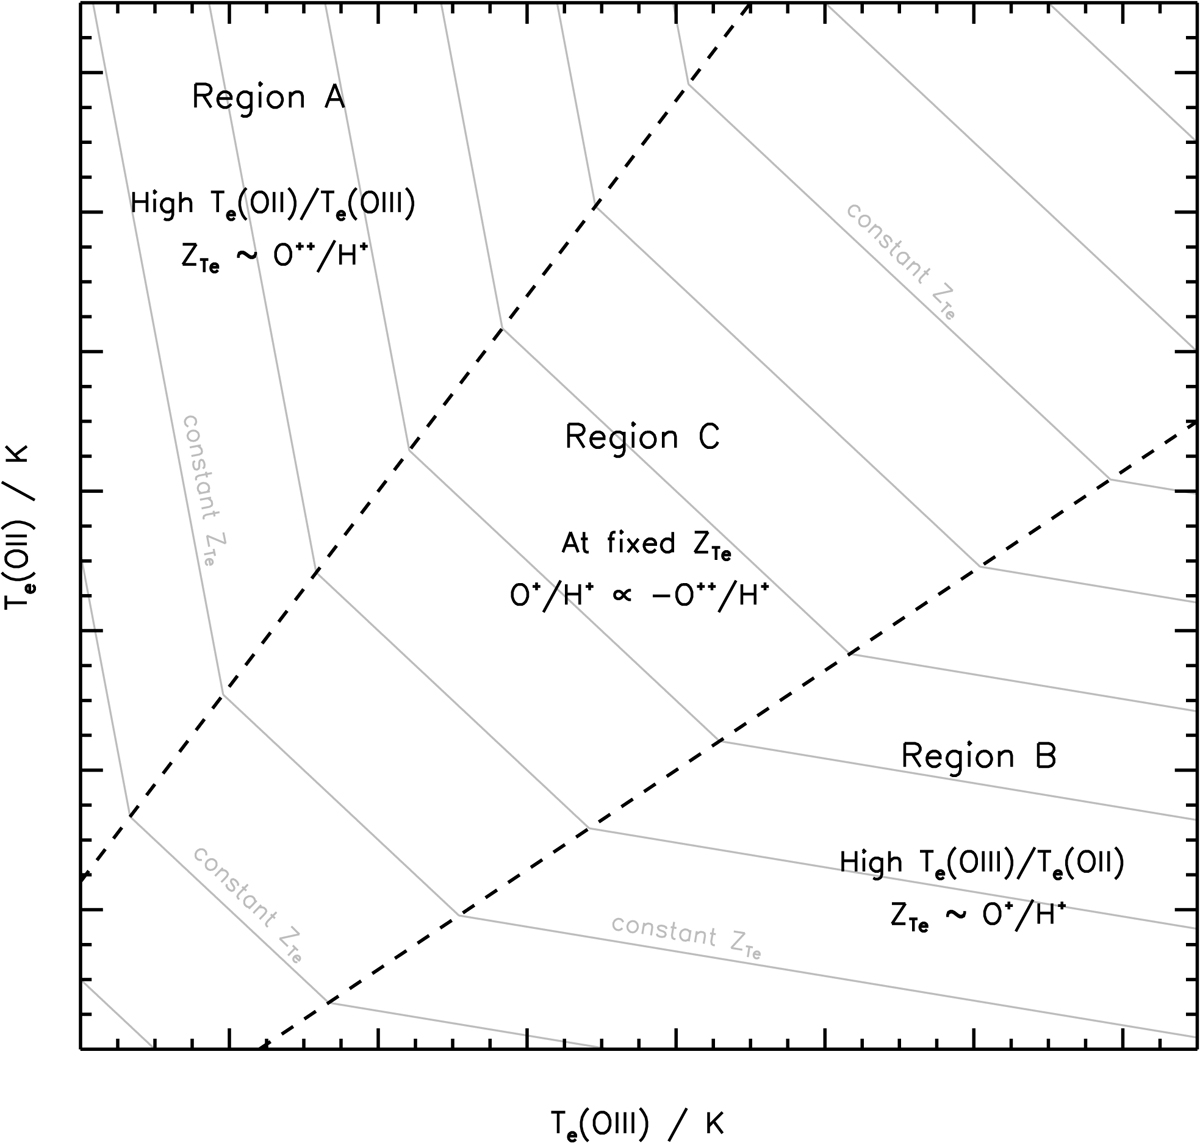
Schematic diagram qualitatively illustrating the expected relation between Te(OIII) and Te(OII) at fixed ZTe in different regions of the Te(OIII)–Te(OII) plane. Grey lines illustrate arbitrary tracks of constant ZTe. Regions A and B denote the approximate regimes where ZTe is likely dominated by only one ionisation state of oxygen (O++/H+ or O+/H+, respectively). Region C denotes the approximate regime where both ionisation states are likely significant, and a uniform anti-correlation between Te(OIII) and Te(OII) at fixed ZTe is expected. We stress that the simplified picture illustrated here may change if, for example, the nebulae are not radiation bounded, or if the density distribution in the O++ and O+ zones are very different.
Current usage metrics show cumulative count of Article Views (full-text article views including HTML views, PDF and ePub downloads, according to the available data) and Abstracts Views on Vision4Press platform.
Data correspond to usage on the plateform after 2015. The current usage metrics is available 48-96 hours after online publication and is updated daily on week days.
Initial download of the metrics may take a while.