Fig. A.2.
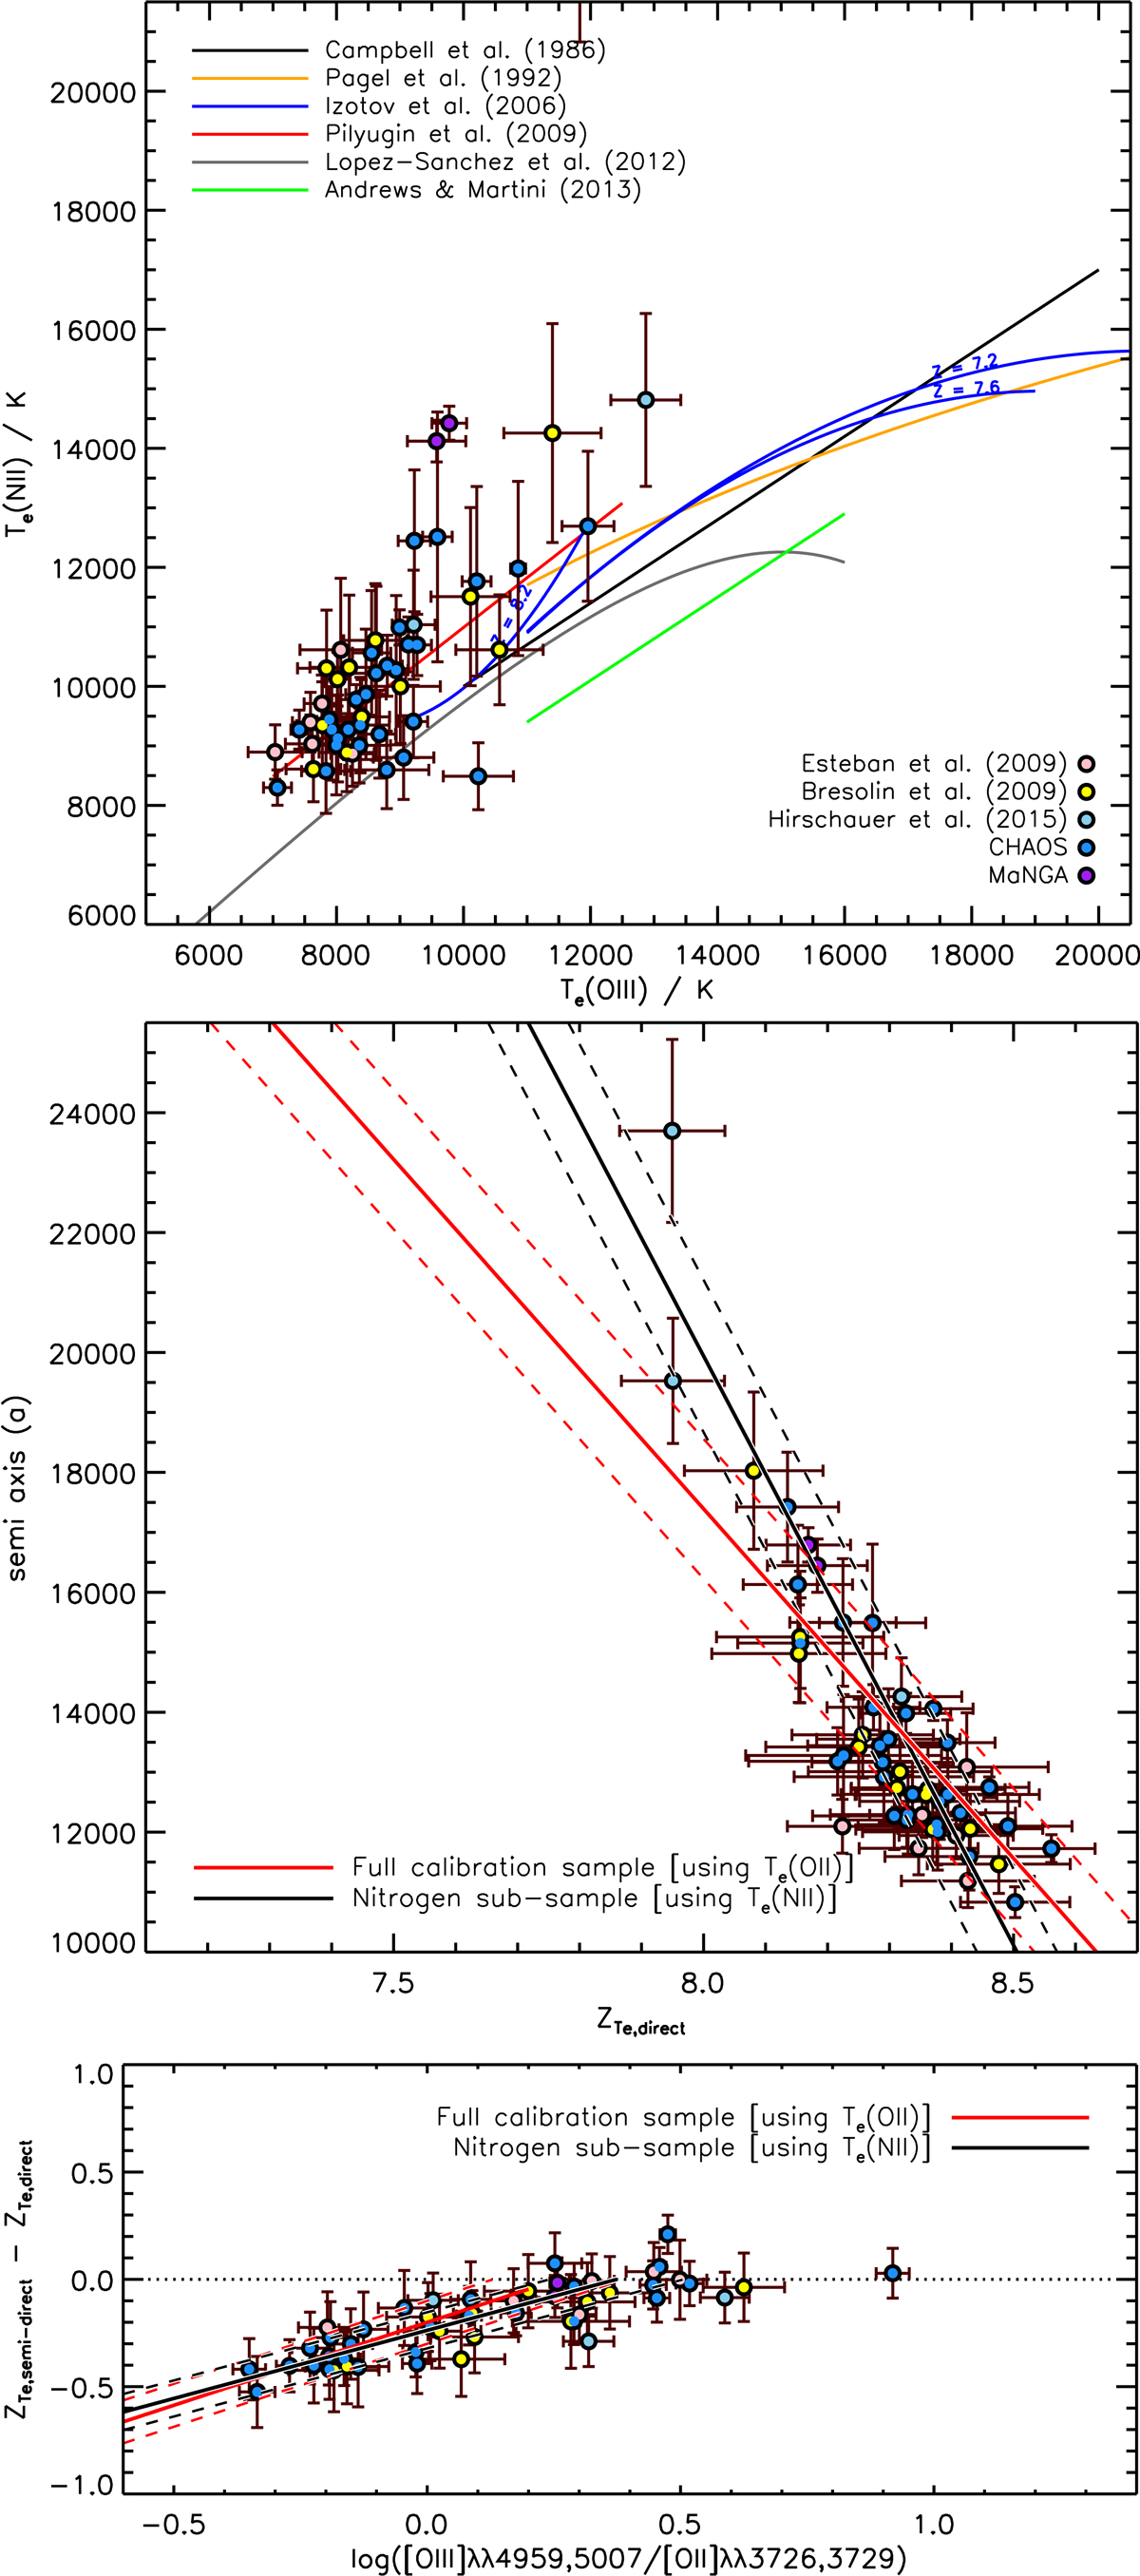
Top panel: Te(OIII)–Te(NII) relation for our nitrogen sub-sample of 53 systems (points). Fits to the Te(OIII)–Te(OII) relation from the literature are also shown. Centre panel: relation between direct ZTe and the hyperbolic semi-axis, a. Red lines indicate the least-squares fit to our full calibration sample, using Te(OII) (see Eq. (10)). Black lines indicate the least-squares fit to our nitrogen sub-sample when using Te(NII). Bottom panel: relation between the semi-direct ZTe deficit and [OIII]/[OII]. Again, red lines denote our least-squares [OII]-based fit (see Fig. 7), black lines denote our least-squares alternative [NII]-based fit.
Current usage metrics show cumulative count of Article Views (full-text article views including HTML views, PDF and ePub downloads, according to the available data) and Abstracts Views on Vision4Press platform.
Data correspond to usage on the plateform after 2015. The current usage metrics is available 48-96 hours after online publication and is updated daily on week days.
Initial download of the metrics may take a while.