Fig. A.1.
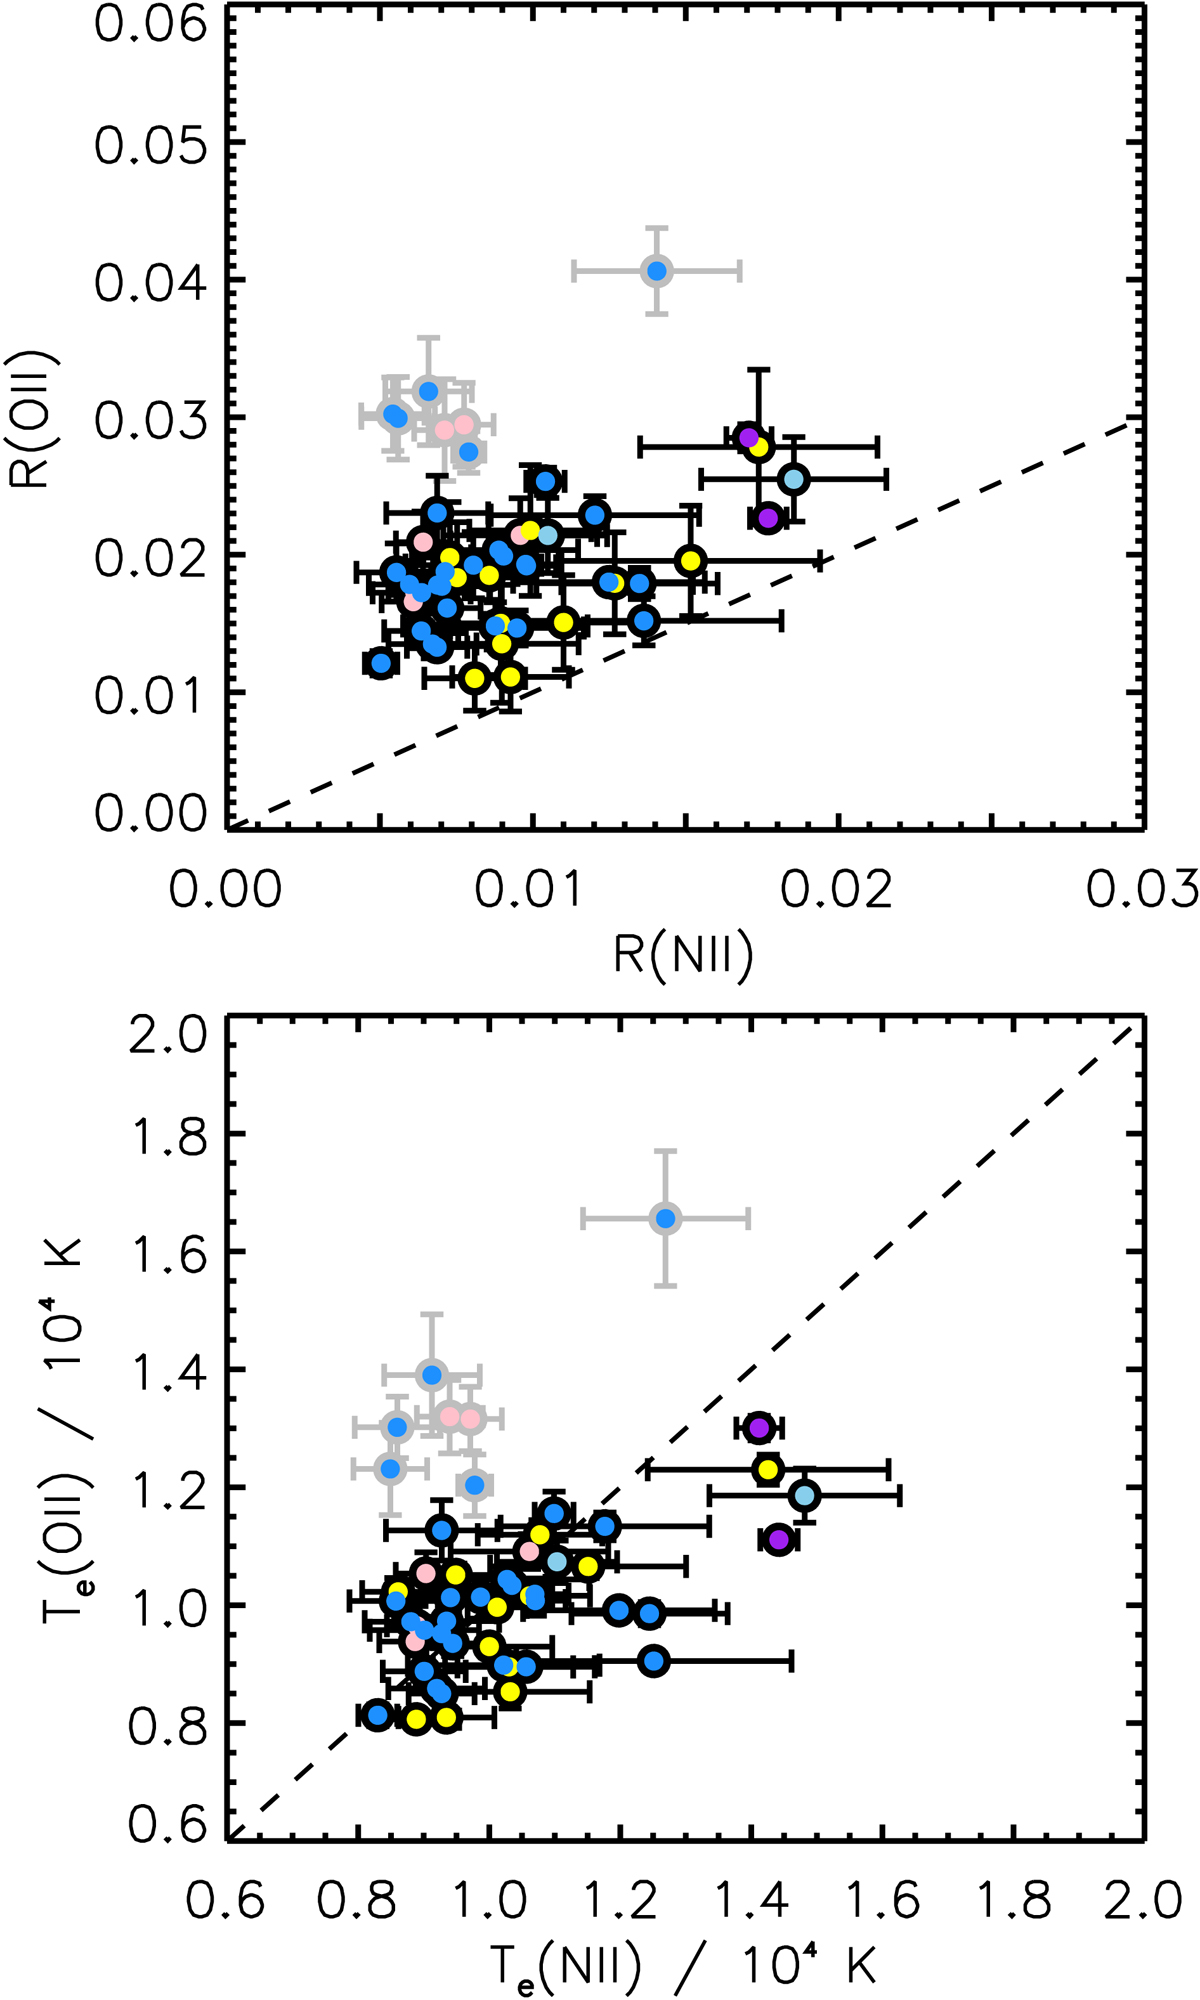
Top panel: relation between R(NII) = [NII]λ5755/(1.33⋅[NII]λ6584) and R(OII) = [OII]λλ7320, 7330/[OII]λλ3726, 3729, for our nitrogen sub-sample of 53 systems. Bottom panel: relation between Te(NII) and Te(OII) for the same nitrogen sub-sample. These two temperatures are expected to be roughly the same for a given HII region, as indicated by the line of equality (dashed line). Points with grey outlines (in both panels) are outliers with T(OII) > T(NII) + 2000 K, or equivalently, R(OII) > R(NII) + 0.0175.
Current usage metrics show cumulative count of Article Views (full-text article views including HTML views, PDF and ePub downloads, according to the available data) and Abstracts Views on Vision4Press platform.
Data correspond to usage on the plateform after 2015. The current usage metrics is available 48-96 hours after online publication and is updated daily on week days.
Initial download of the metrics may take a while.