Fig. 12.
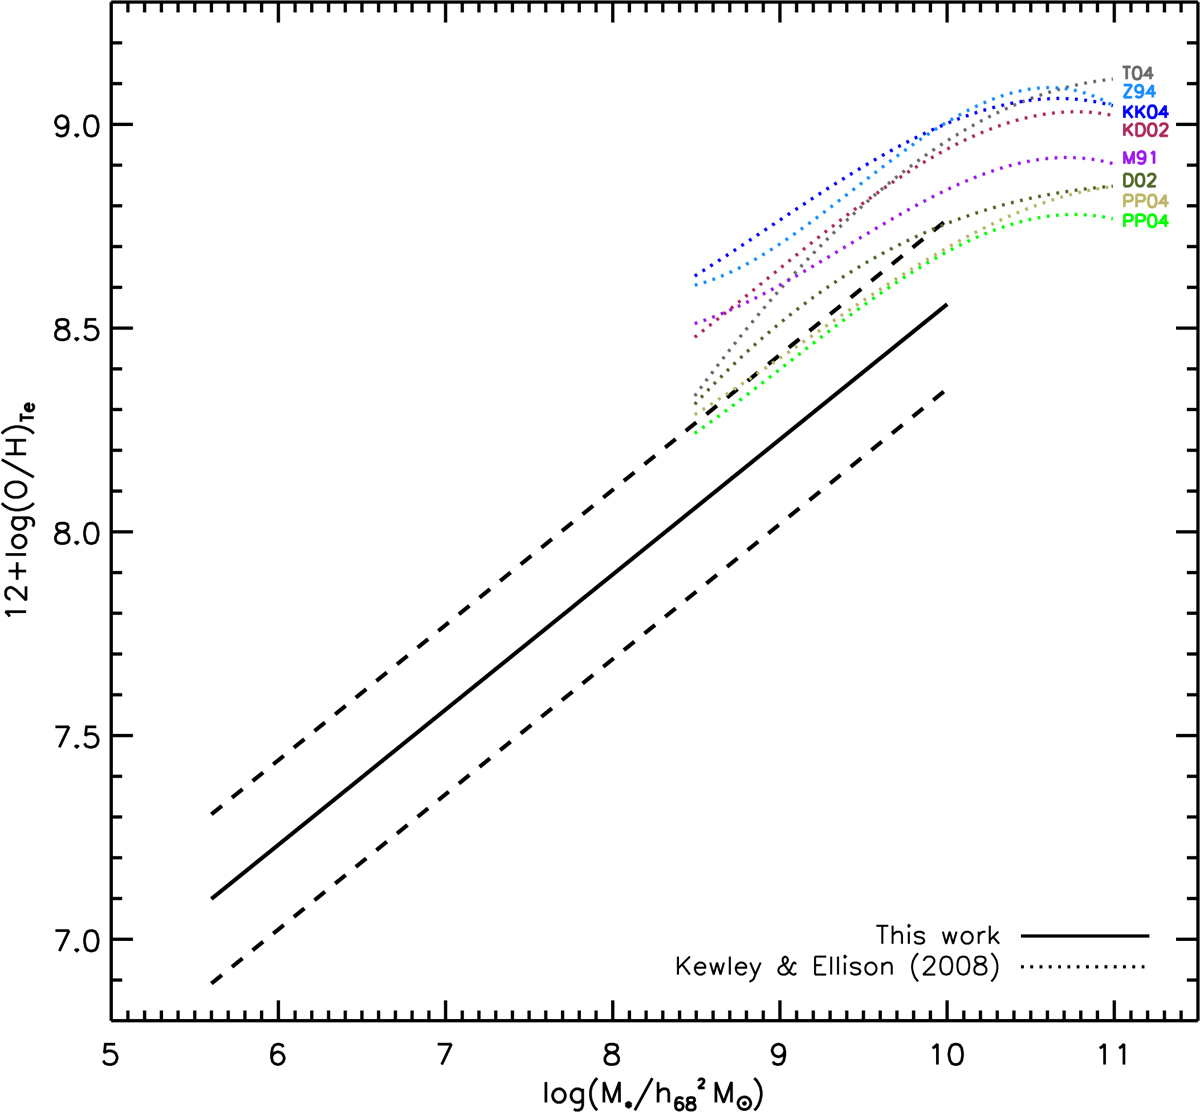
Comparison between our new Te-based MZR (solid black line, Eq. (14)) and various strong-line-based MZRs presented by Kewley & Ellison (2008, dotted lines). As for many other ZTe studies, we find a lower normalisation for our MZR compared to the strong-line-based relations, although the slope is quite similar among most cases below log(M*/M⊙)∼10.0.
Current usage metrics show cumulative count of Article Views (full-text article views including HTML views, PDF and ePub downloads, according to the available data) and Abstracts Views on Vision4Press platform.
Data correspond to usage on the plateform after 2015. The current usage metrics is available 48-96 hours after online publication and is updated daily on week days.
Initial download of the metrics may take a while.