Fig. C.2.
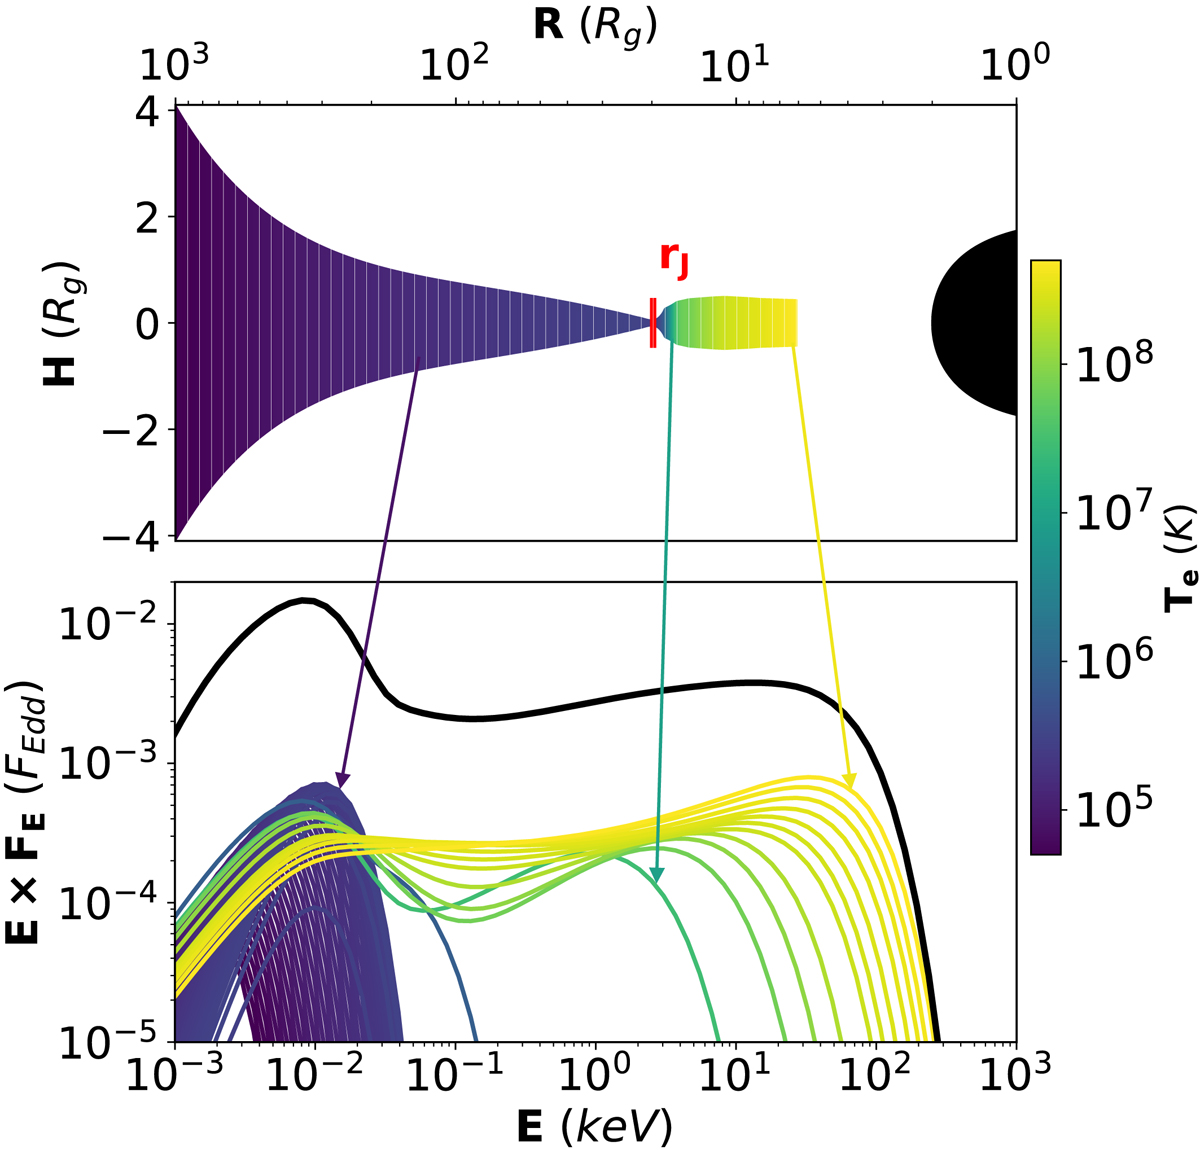
Top panel: computed geometrical shape of the SAD–JED, divided in annuli, colour-coded according to the electron temperature. Bottom panel: total emitted spectrum (in black) with the contribution from each annulus, using the same colour-coding as above. The arrows associate three annuli at different radii with their spectrum.
Current usage metrics show cumulative count of Article Views (full-text article views including HTML views, PDF and ePub downloads, according to the available data) and Abstracts Views on Vision4Press platform.
Data correspond to usage on the plateform after 2015. The current usage metrics is available 48-96 hours after online publication and is updated daily on week days.
Initial download of the metrics may take a while.