Fig. 2.
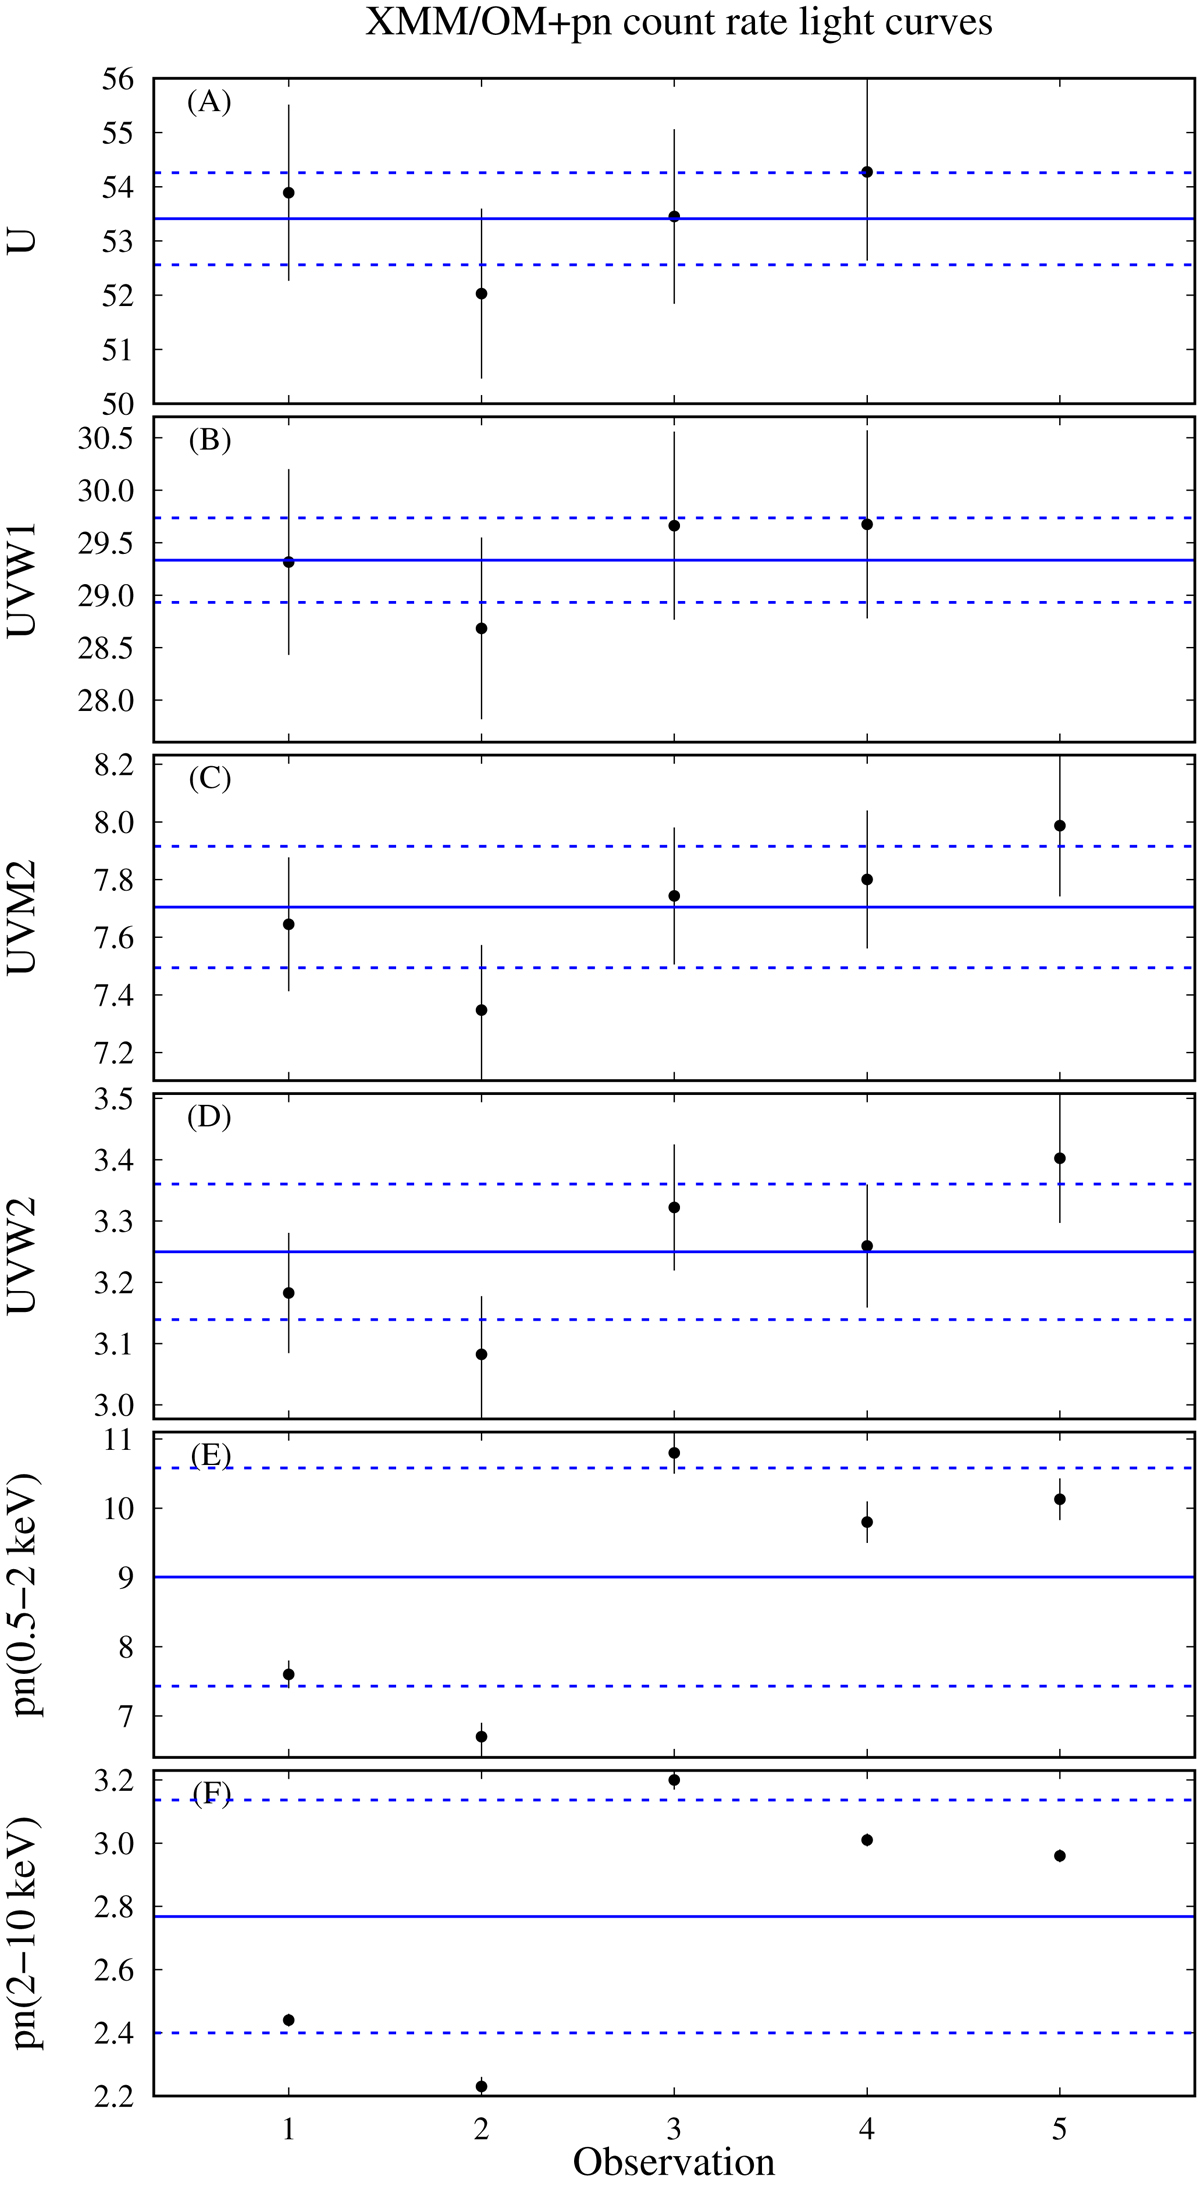
Light curves of each of the four XMM–Newton/OM photometric filters: U (panel A), UVW1 (panel B), UVM2 (panel C), UVW2 (panel D); and light curves, averaged over each observation, of XMM–Newton/pn in the bands 0.5–2 keV (panel E) and 2–10 keV (panel F). The U and UVW1 filters were not available during Obs. 5. The blue solid lines represent the mean value of the count rate over the five observations, while the blue dashed lines represent the standard deviation (i.e. the root mean square of the deviations from the mean).
Current usage metrics show cumulative count of Article Views (full-text article views including HTML views, PDF and ePub downloads, according to the available data) and Abstracts Views on Vision4Press platform.
Data correspond to usage on the plateform after 2015. The current usage metrics is available 48-96 hours after online publication and is updated daily on week days.
Initial download of the metrics may take a while.