Fig. 11.
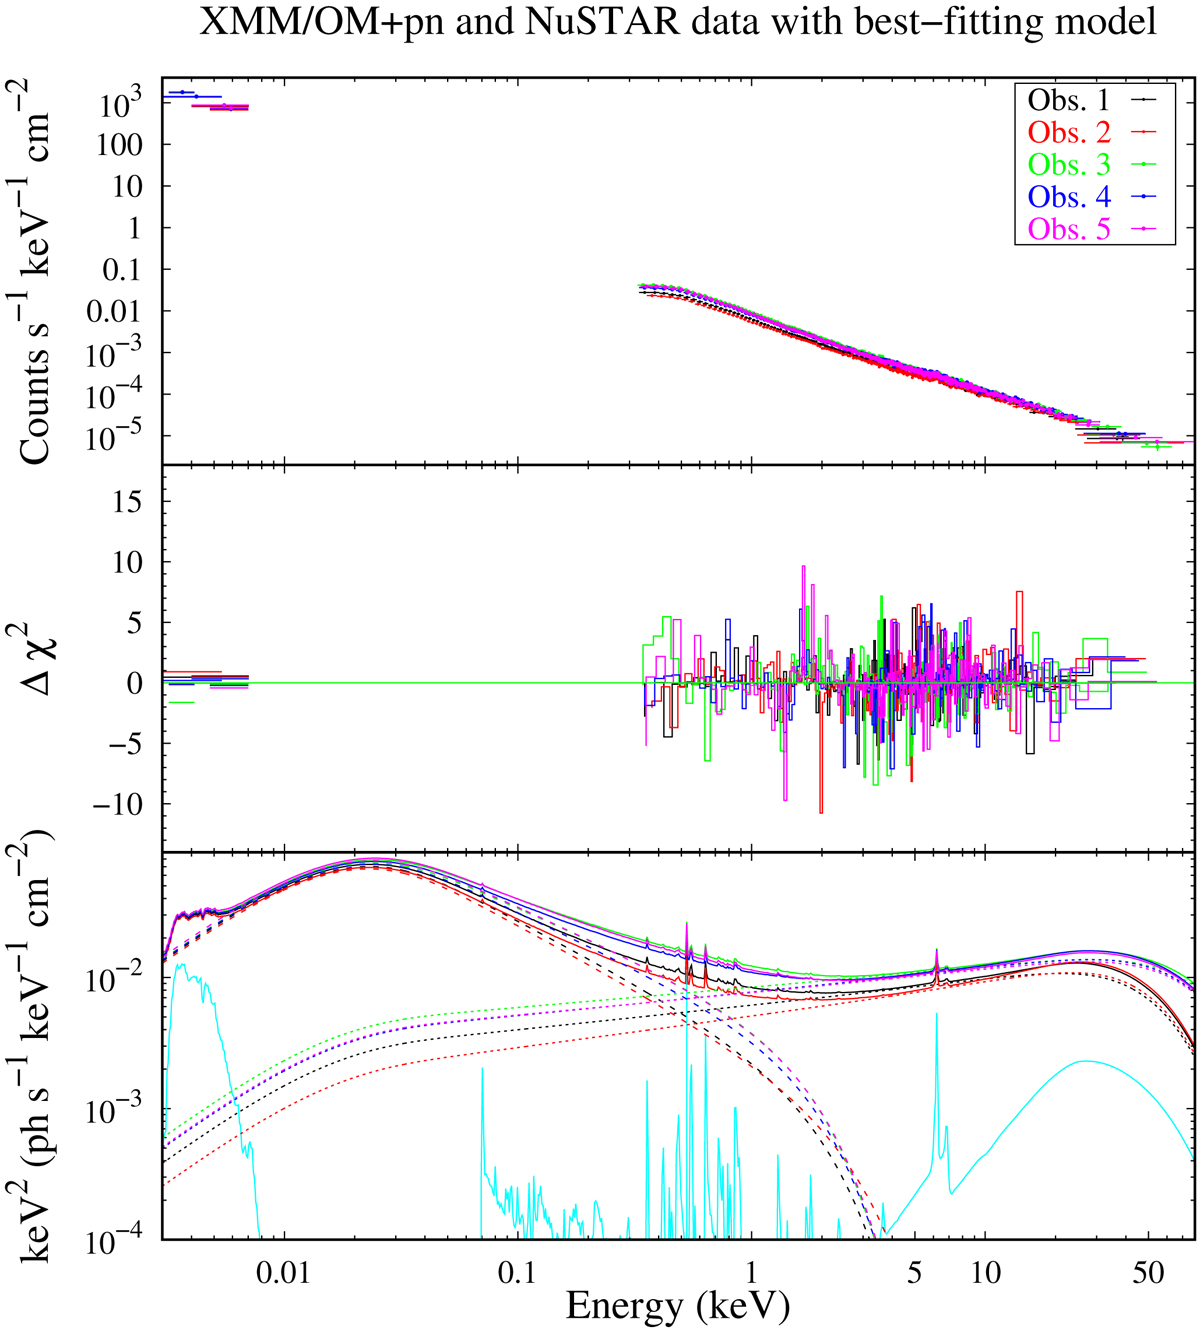
Broad-band UV–X-ray data and best-fitting model discussed in Sect. 4.5 (see Table 4). Upper panel: XMM–Newton/OM, pn, and NuSTAR data (rebinned for plotting purposes) with folded model. Middle panel: contribution to χ2. Bottom panel: best-fitting model E2f(E), without absorption, with the plot of the warm and hot NTHCOMP components (dashed and dotted lines, respectively), the small blue bump, the Gaussian line at 0.54 keV, and the reflection component (cyan solid lines).
Current usage metrics show cumulative count of Article Views (full-text article views including HTML views, PDF and ePub downloads, according to the available data) and Abstracts Views on Vision4Press platform.
Data correspond to usage on the plateform after 2015. The current usage metrics is available 48-96 hours after online publication and is updated daily on week days.
Initial download of the metrics may take a while.