Free Access
Fig. 4
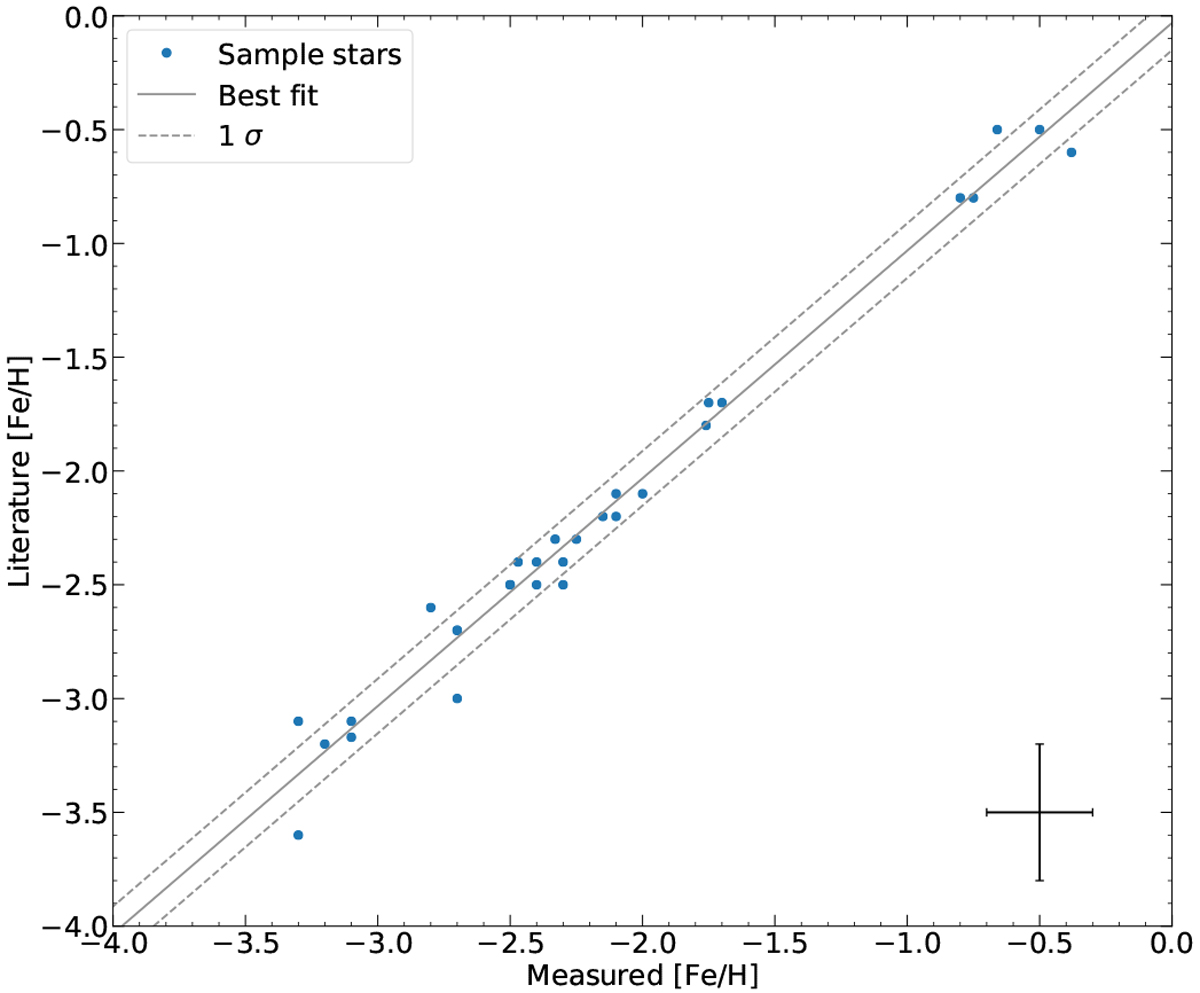
Our[Fe/H], of all 28 stars from Table 1, based on EWs of Fe lines compared to Hansen et al. (2016a, 2019). A clear 1:1 linear correlation is seen with a low scatter (< σ). A general uncertainty is plotted in the lower right corner.
Current usage metrics show cumulative count of Article Views (full-text article views including HTML views, PDF and ePub downloads, according to the available data) and Abstracts Views on Vision4Press platform.
Data correspond to usage on the plateform after 2015. The current usage metrics is available 48-96 hours after online publication and is updated daily on week days.
Initial download of the metrics may take a while.