Fig. 7.
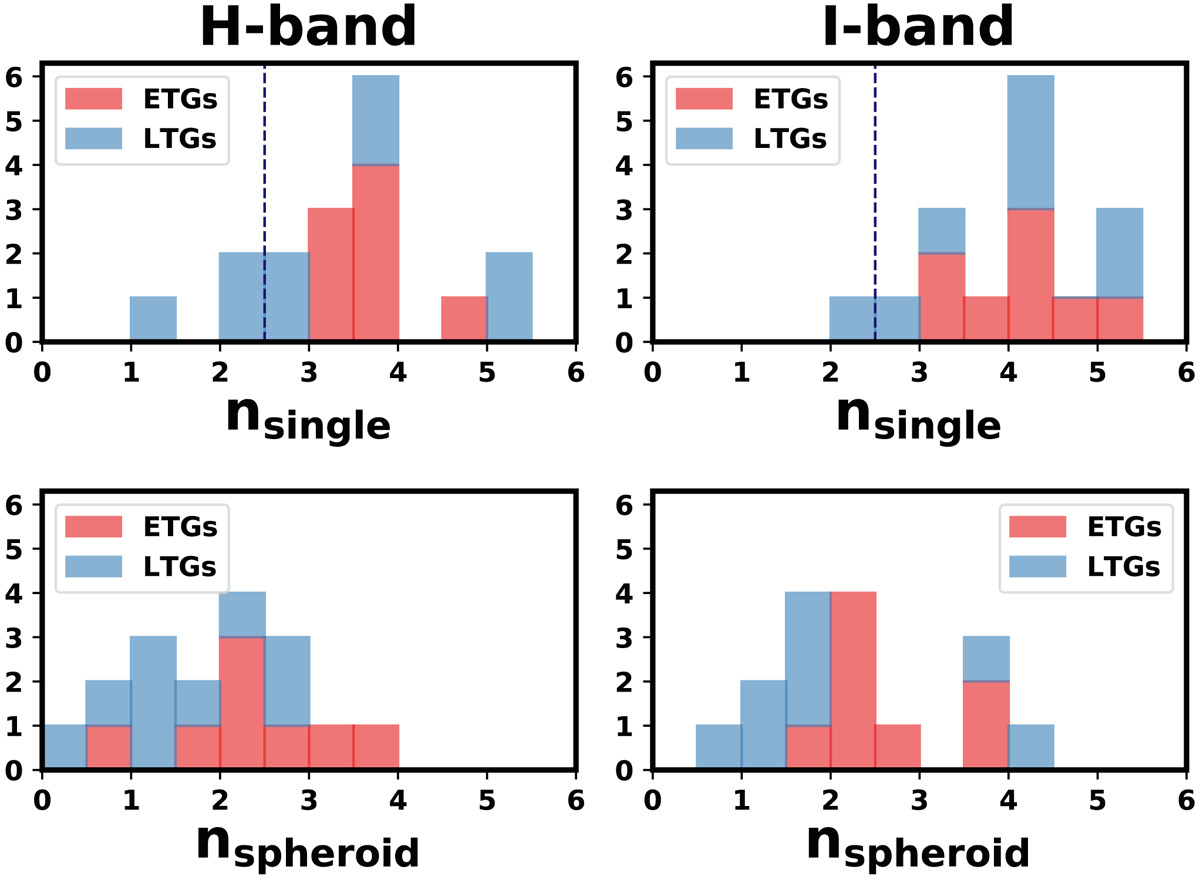
Sérsic index histograms for single Sérsic fit values (top panels) and for the spheroid component (bottom panels) in the B+D decomposition, both for the H (left panels) and the I band (right panels). The dashed gray line represents the division line between disk-dominated (n < 2.5) and spheroid-dominated (n > 2.5) objects. Our sample contains nine visually classified LTGs, yet single Sérsic fits in the H band yield only three galaxies being classifiable as disk-like on the basis of n. Bottom panels: histograms showing that the majority of our sample contains a spheroidal component with a low Sérsic index (nspheroid < 3) in both bands, pointing to bulges of moderate light concentration.
Current usage metrics show cumulative count of Article Views (full-text article views including HTML views, PDF and ePub downloads, according to the available data) and Abstracts Views on Vision4Press platform.
Data correspond to usage on the plateform after 2015. The current usage metrics is available 48-96 hours after online publication and is updated daily on week days.
Initial download of the metrics may take a while.