Fig. 4.
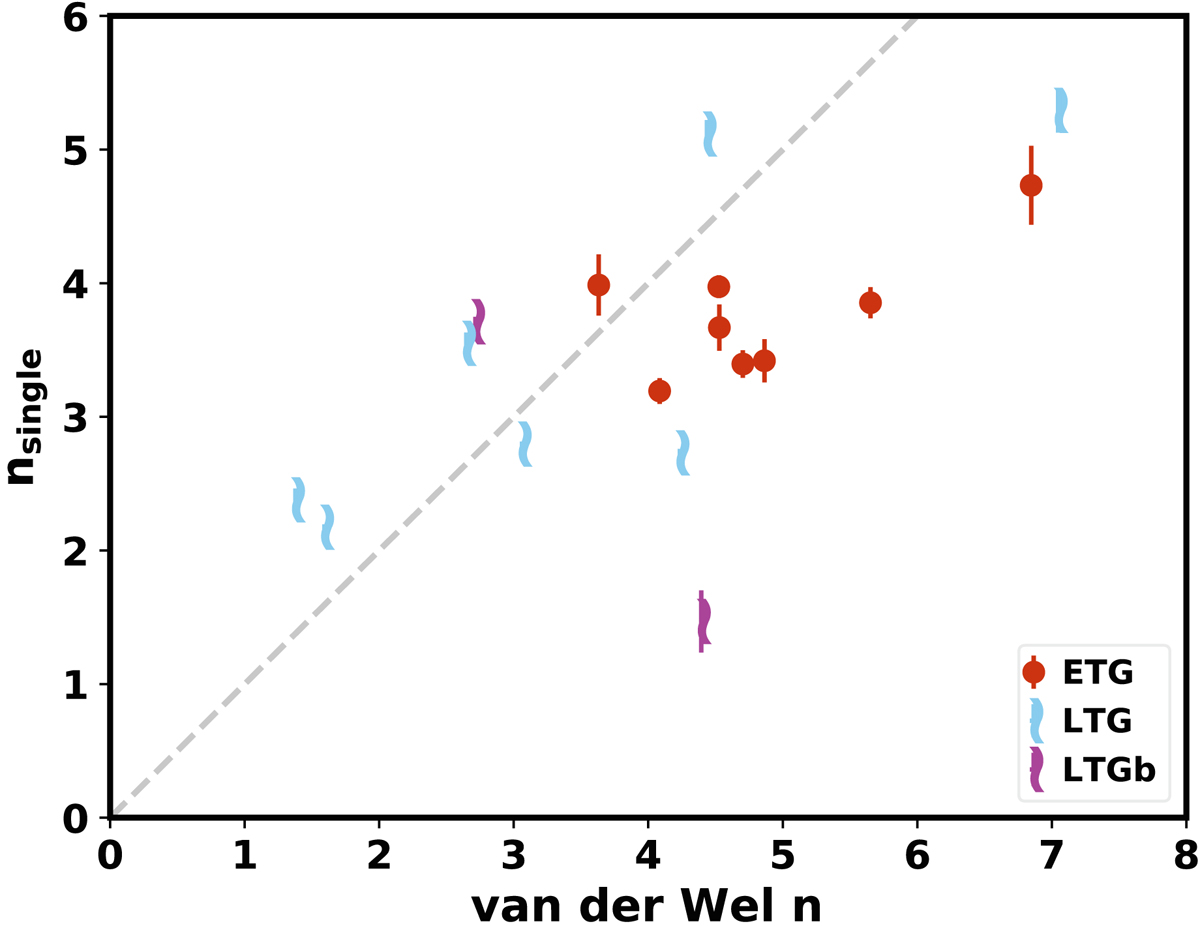
Comparison between our H-band single Sérsic index and that obtained by van der Wel et al. (2012). Our sample is color-coded as in Fig. 3. Error bars come from the simulations described in Appendix A. The divergence in the case of ETGs can be related with their concentrated nature. In the case of LTGs, the discrepancy may be due to the fact that the luminosity profiles of these galaxies cannot be properly described with a simple Sérsic function.
Current usage metrics show cumulative count of Article Views (full-text article views including HTML views, PDF and ePub downloads, according to the available data) and Abstracts Views on Vision4Press platform.
Data correspond to usage on the plateform after 2015. The current usage metrics is available 48-96 hours after online publication and is updated daily on week days.
Initial download of the metrics may take a while.