Fig. 13.
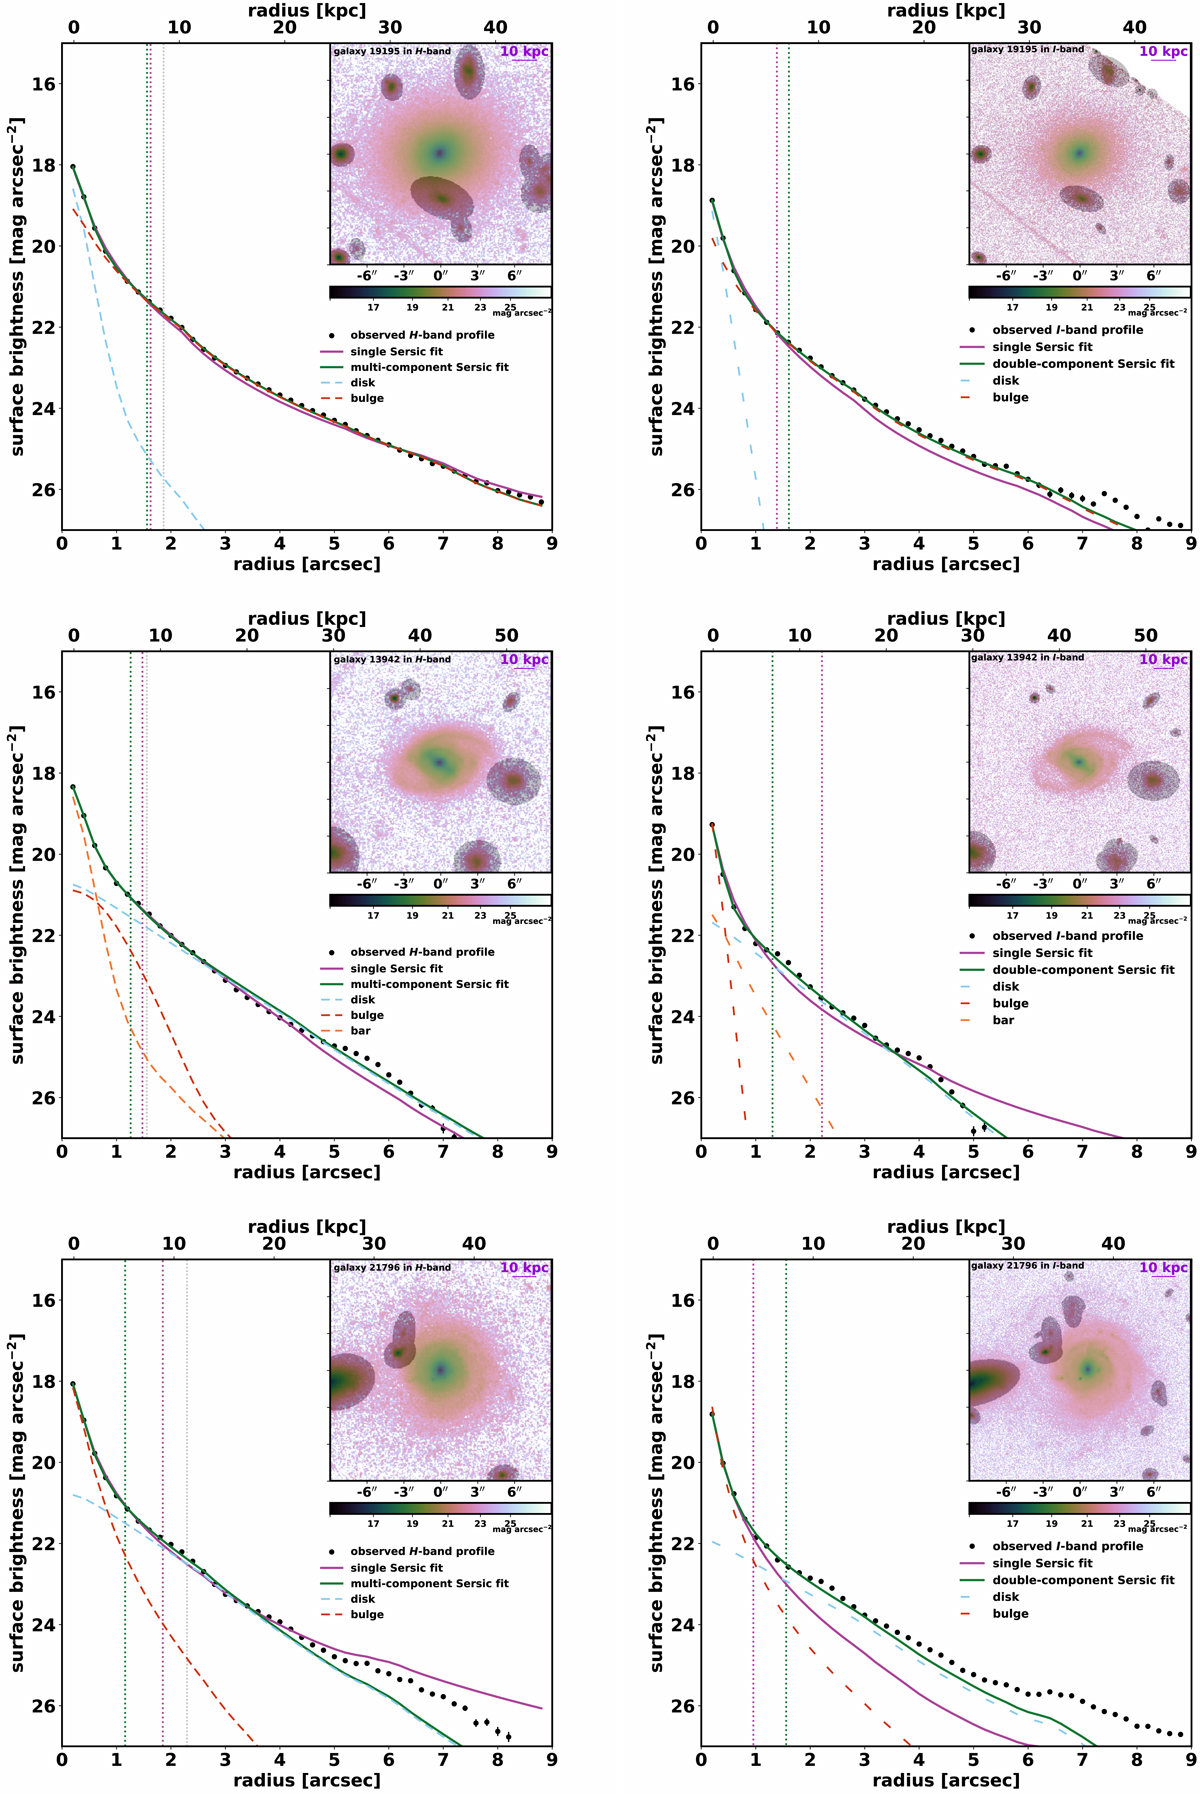
Surface brightness profiles in the H band (left panels) and in the I band (right panels) for three systems illustrating the different galaxy morphologies in our sample: the early-type galaxy 19195 (top panels), the barred late-type galaxy 13942 (middle panels), and the late-type galaxy 21796 (bottom panels). The results from single- and multi-component Sérsic models are shown in violet and green, respectively. Black points represent the observed surface brightness profile; solid lines show the models convolved with the PSF; dashed lines stand for the decomposition of the multi-component model into bulge (red), disk (blue), and bar (orange); dotted vertical lines represent the effective radius; and the dotted gray vertical line is the van der Wel et al. (2012) (single Sérsic) effective radius. We display the galaxy stamp in units of surface brightness (mag arcsec−2; see the horizontal color bar beneath each map) with shadowed areas matching the masks used to obtain the observed light profile, the galaxy ID in the top left corner, and a scale bar in the top right corresponding to 10 kpc.
Current usage metrics show cumulative count of Article Views (full-text article views including HTML views, PDF and ePub downloads, according to the available data) and Abstracts Views on Vision4Press platform.
Data correspond to usage on the plateform after 2015. The current usage metrics is available 48-96 hours after online publication and is updated daily on week days.
Initial download of the metrics may take a while.