Fig. 11.
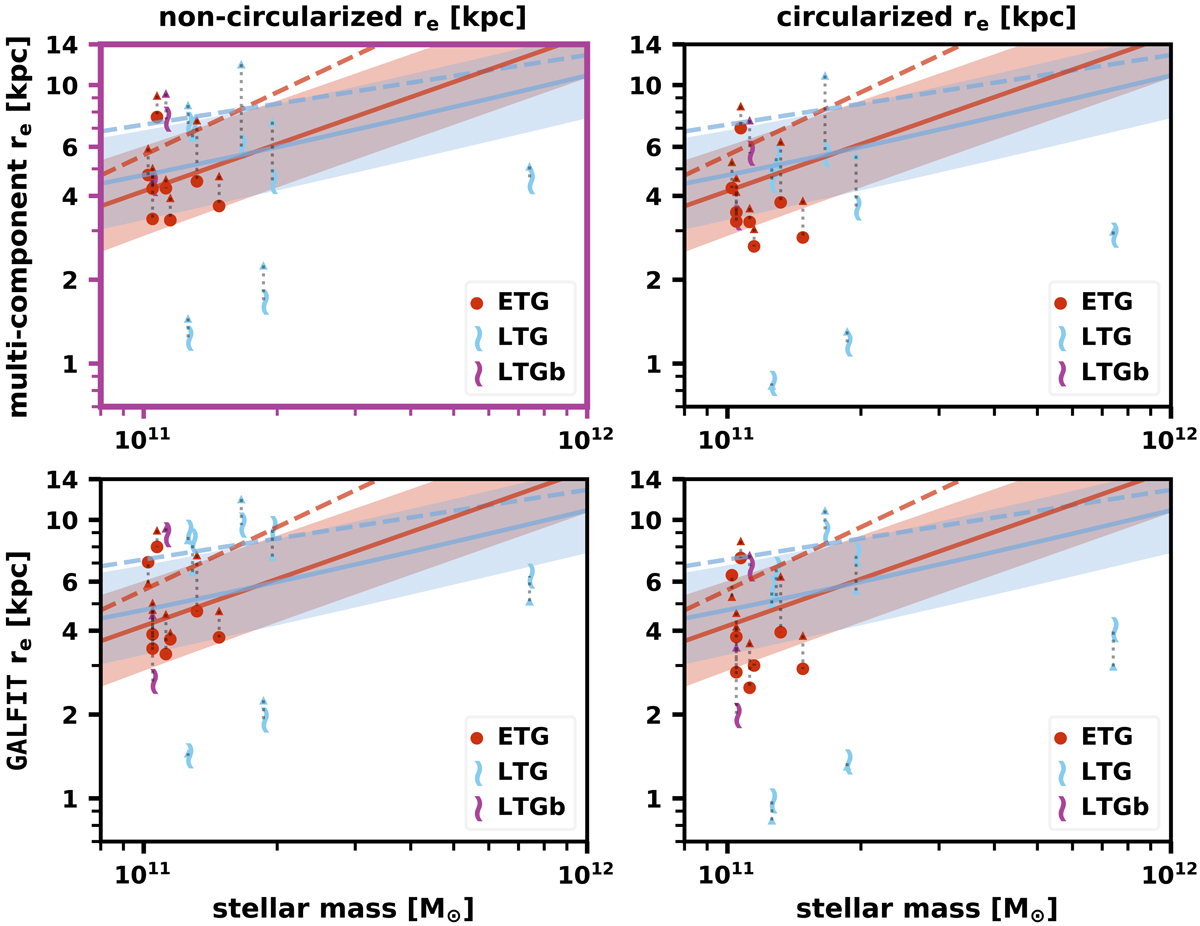
Size-stellar mass distribution of our H-band data, linked to van der Wel et al. (2012) results represented by triangles. Left panels: noncircularized effective radii, while the right panels show the circularized ones (re, circ). Top panels: correspond to our computed multi-component effective radii, whereas the bottom panels show the GALFIT single Sérsic effective radii. The Shen et al. (2003) local relation for ETGs and LTGs is represented by the solid red and blue lines, respectively, with the corresponding scatter being the shaded red and blue regions. The colored dashed lines correspond to the van der Wel et al. (2014) mass-size relations at z = 0.25, as obtained from noncircularized re determinations. Our results lie within the scatter of Shen et al. (2003) local relation. We choose to highlight in purple the axis of our preferred plot since it shows the values of the most representative effective radius (multi-component re) without circularization (as in the works that we use for comparison).
Current usage metrics show cumulative count of Article Views (full-text article views including HTML views, PDF and ePub downloads, according to the available data) and Abstracts Views on Vision4Press platform.
Data correspond to usage on the plateform after 2015. The current usage metrics is available 48-96 hours after online publication and is updated daily on week days.
Initial download of the metrics may take a while.