Fig. 5.
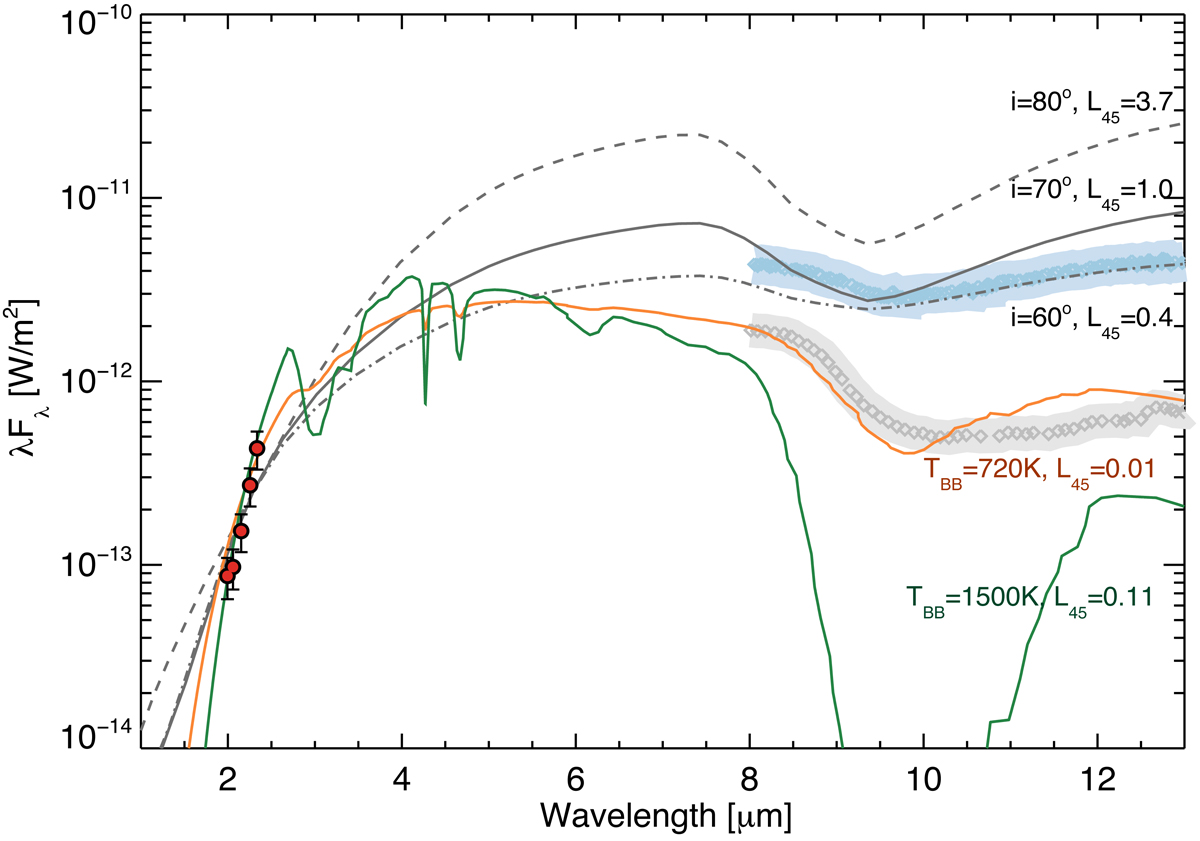
K-band flux density observed with GRAVITY is shown in filled circles. The MIR flux density (incl. uncertainty) taken from Raban et al. (2009) is shown in grey (central 20 mas component only) and in blue (total MIR flux observed with MIDI within few 10 pc). In black, we show three torus models from Stalevski et al. (2012) with different inclinations of i = 60° (dash-dotted), i = 70° (solid) and i = 80° (dashed). The two single temperature black body models are overplotted. Model 2 in orange (Teff = 720 K, r = 0.24 pc and dr = 0.045 pc.). Model 3 in green (Teff = 1500 K, AK = 5.5, r = 0.24 pc and dr = 0.026 pc). The bolometric luminosities of the different models are indicated in units of L45 = Lbol/1045 erg s−1.
Current usage metrics show cumulative count of Article Views (full-text article views including HTML views, PDF and ePub downloads, according to the available data) and Abstracts Views on Vision4Press platform.
Data correspond to usage on the plateform after 2015. The current usage metrics is available 48-96 hours after online publication and is updated daily on week days.
Initial download of the metrics may take a while.