Fig. 4.
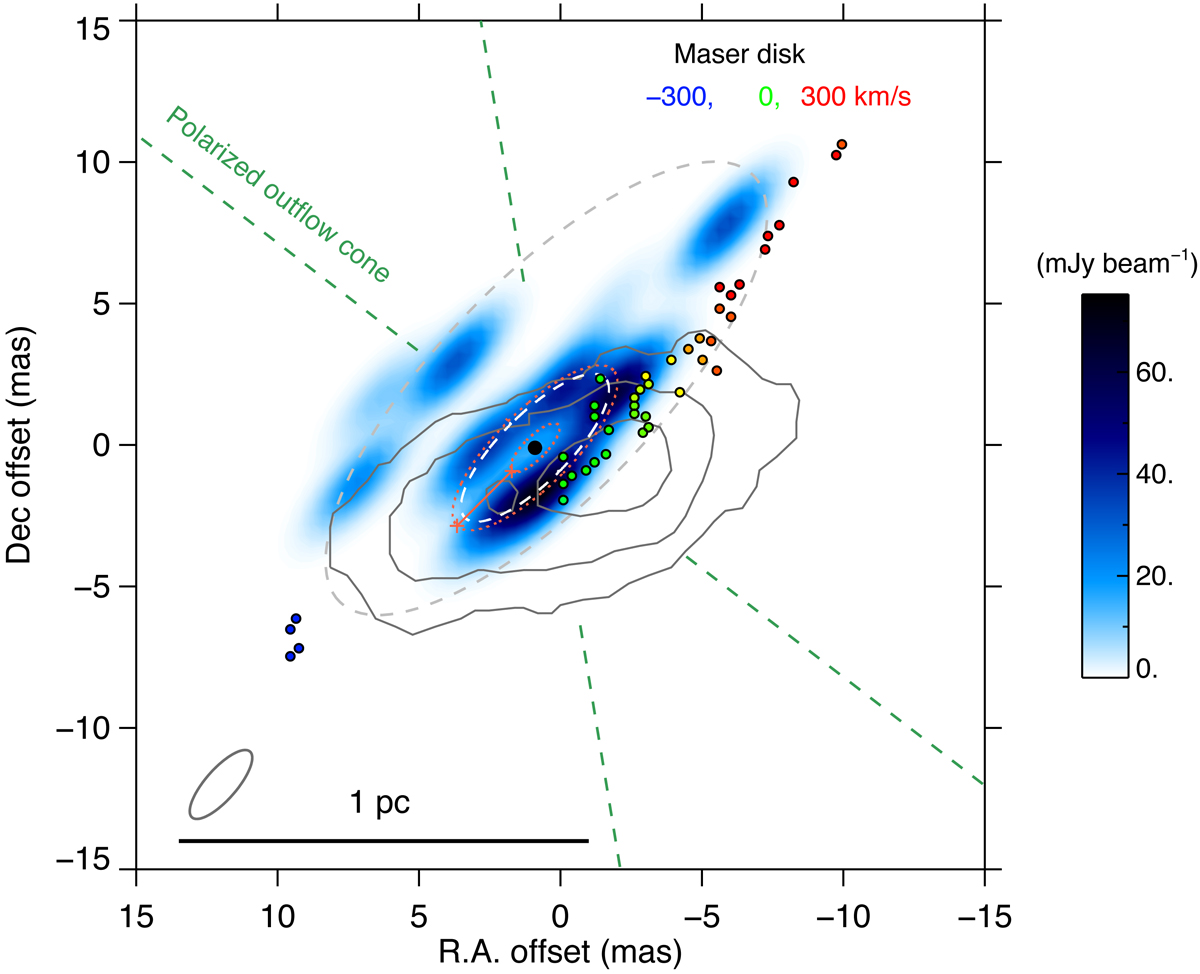
Reconstructed image of the inner 2.1 × 2.1 pc of NGC 1068 (i.e. the central region of Fig. 3). The best fitting circular ring is shown in dashed white (r = 0.24 pc (3.5 mas). The dust sublimation sizes for the range of bolometric luminosities (∼0.08–0.27 pc) are shown in orange dotted ellipses (Lbol = 0.4–4.7 × 1045 erg s−1). The filled black circle indicates the position of the AGN, corresponding to the kinematic centre of the masers. The radio continuum (grey contours) and the maser emission (filled coloured circles) were extracted from Gallimore et al. (2004) and aligned based on the re-analysis of Gallimore & Impellizzeri (2019). The radio and IR images are aligned based on the continuum peaks. The green dashed lines indicate the bipolar outflow cone observed in IR polarisation on scales of few hundred mas (Gratadour et al. 2015). The orientation of the polarisation cone is very similar to the large scale ionisation cone found by Das et al. (2006). The grey dashed ellipse indicates the observed 10 μm emission size (taken from Raban et al. 2009). The elliptical beam, used for the reconstruction, is shown in the lower left corner.
Current usage metrics show cumulative count of Article Views (full-text article views including HTML views, PDF and ePub downloads, according to the available data) and Abstracts Views on Vision4Press platform.
Data correspond to usage on the plateform after 2015. The current usage metrics is available 48-96 hours after online publication and is updated daily on week days.
Initial download of the metrics may take a while.