Fig. 1.
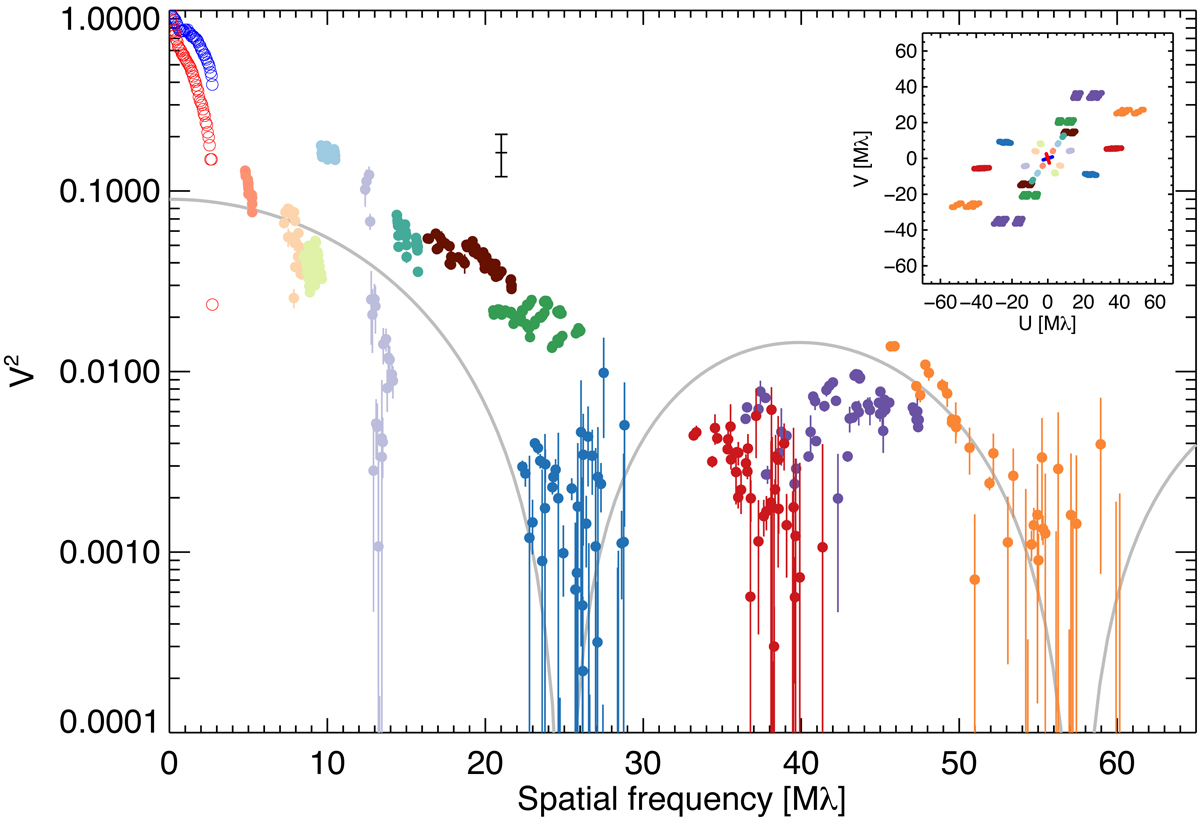
Squared visibilities measured for NGC 1068. The light coloured filled data points were obtained with the AT array in compact configuration (spatial frequencies 5 < f < 17 Mλ.). The high spatial frequency data were taken with the UT array. The small inset shows the corresponding UV coordinates. The open blue and red symbols (spatial frequencies f < 4 Mλ) represent speckle data from Weigelt et al. (2004), which are shown only for comparison; they were not used for the image reconstruction. The data point and error bar at a spatial frequency of 21 Mλ, lying above our new data, shows the only previous NIR VLTI detection of NGC 1068 (Wittkowski et al. 2004). For comparison, the grey continuous line shows the visibility of a thin ring-shaped emission region with a radius of 3.3 mas and a width of 0.5 mas scaled to a maximum visibility of 0.3. While this reflects the general shape of the visibility distribution, it is a poor fit and indicates that more complex structures are present.
Current usage metrics show cumulative count of Article Views (full-text article views including HTML views, PDF and ePub downloads, according to the available data) and Abstracts Views on Vision4Press platform.
Data correspond to usage on the plateform after 2015. The current usage metrics is available 48-96 hours after online publication and is updated daily on week days.
Initial download of the metrics may take a while.