Fig. 4.
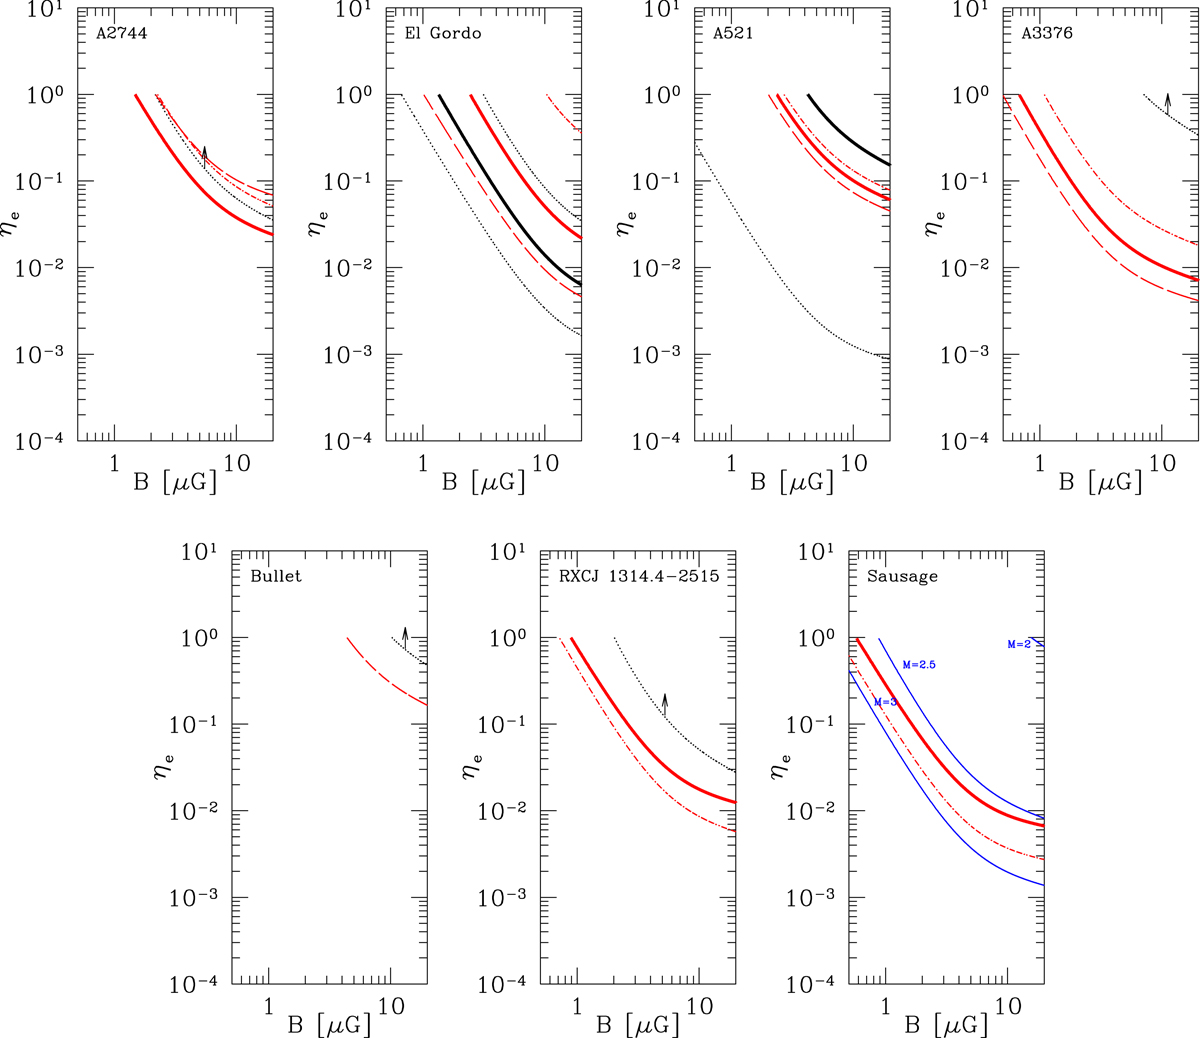
Electron acceleration efficiency for the radio relics of the sample vs. magnetic field in the downstream region. Calculations were performed using the Mach numbers listed in Table 3 measured in the X-rays (black) and derived from the integrated spectral index in the case of DSA (red). Lines denote the best fit Mach numbers (solid), the X-ray upper and lower bounds (dotted), and the upper (long dashed) and lower (dot-dashed) bounds of ℳDSA. For the Sausage relic, lines in blue represent assumed Mach numbers of ℳ = 2, 2.5, and 3 (from top to bottom).
Current usage metrics show cumulative count of Article Views (full-text article views including HTML views, PDF and ePub downloads, according to the available data) and Abstracts Views on Vision4Press platform.
Data correspond to usage on the plateform after 2015. The current usage metrics is available 48-96 hours after online publication and is updated daily on week days.
Initial download of the metrics may take a while.