Open Access
Fig. 10.
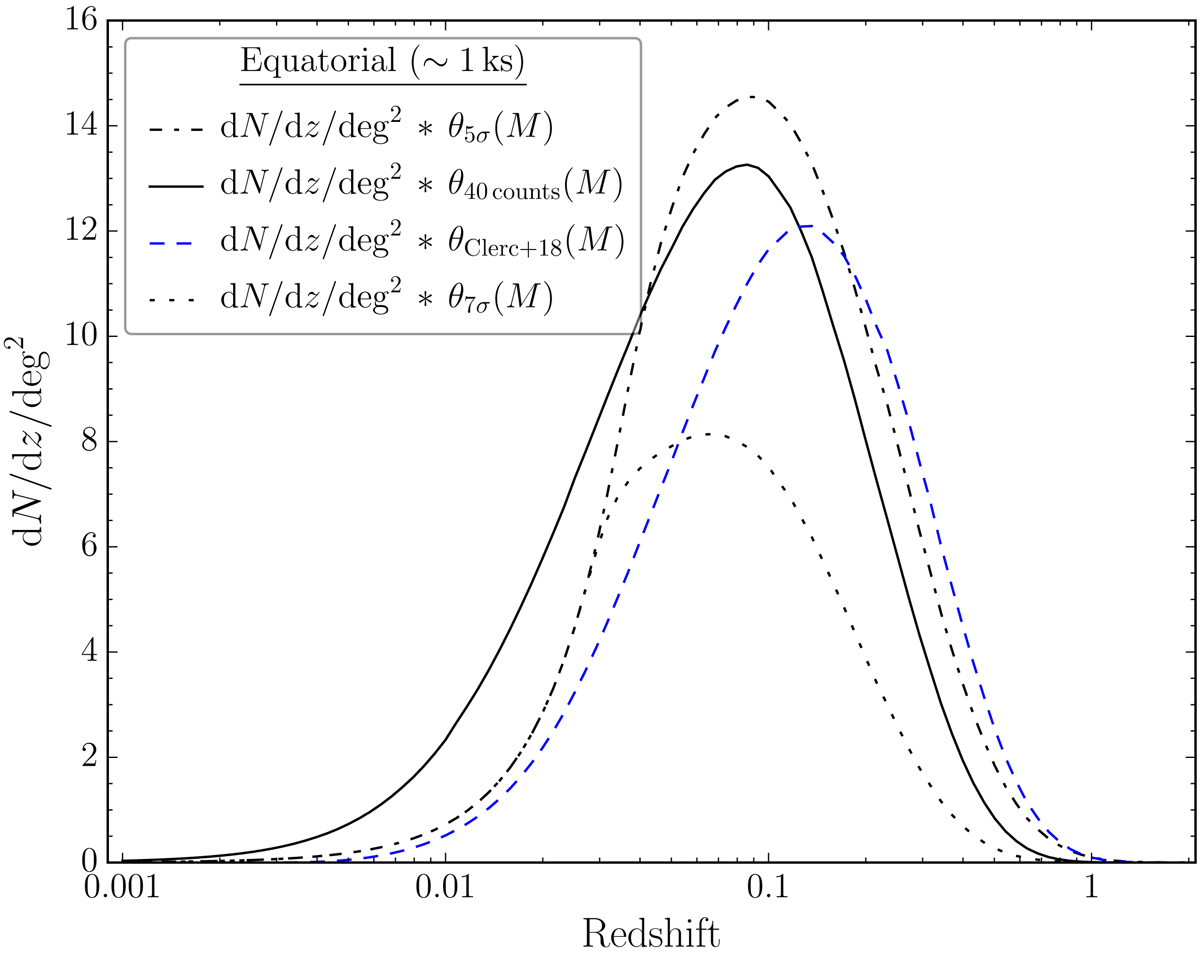
Expected differential number of galaxy clusters per square degree as a function of redshift for the final equatorial eROSITA survey field with different selection functions folded in. The solid line serves as comparison and show the 40 aperture count selection on the 1–4′ scale of Fig. 6.
Current usage metrics show cumulative count of Article Views (full-text article views including HTML views, PDF and ePub downloads, according to the available data) and Abstracts Views on Vision4Press platform.
Data correspond to usage on the plateform after 2015. The current usage metrics is available 48-96 hours after online publication and is updated daily on week days.
Initial download of the metrics may take a while.