Fig. 1.
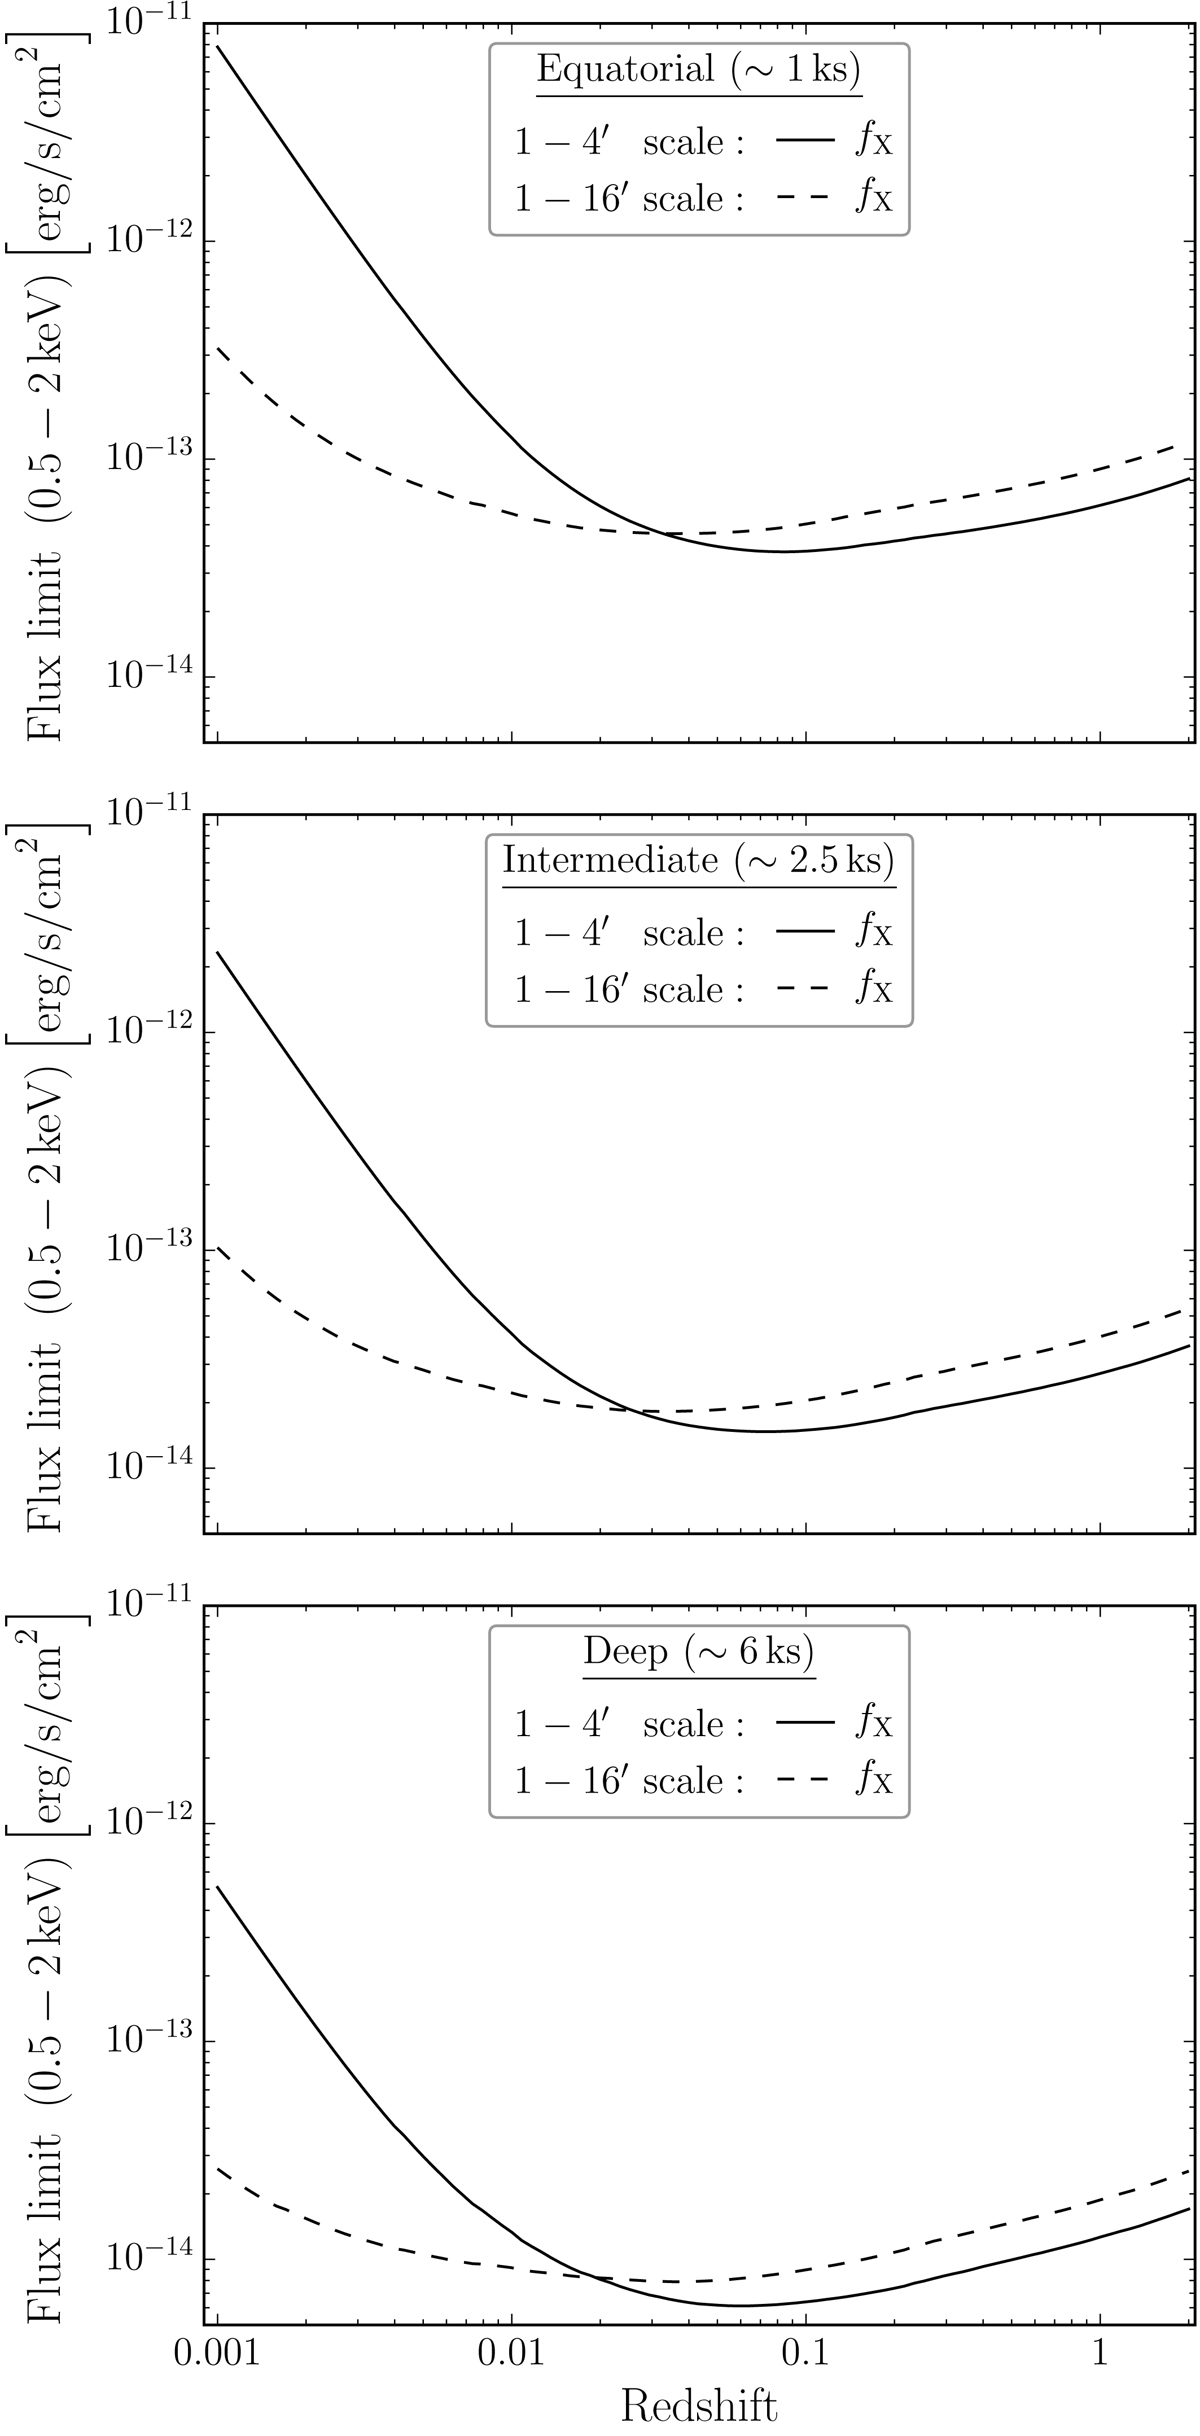
Galaxy cluster flux limit as a function of redshift for an equatorial, an intermediate, and a deep final eROSITA survey field of approximately 1 ks, 2.5 ks, and 6 ks exposure, respectively. The black solid and black dashed lines show the flux limits corresponding to 40 and 80 counts in the detection region of 1–4′ and 1–16′ radial scale, respectively.
Current usage metrics show cumulative count of Article Views (full-text article views including HTML views, PDF and ePub downloads, according to the available data) and Abstracts Views on Vision4Press platform.
Data correspond to usage on the plateform after 2015. The current usage metrics is available 48-96 hours after online publication and is updated daily on week days.
Initial download of the metrics may take a while.