Fig. 9.
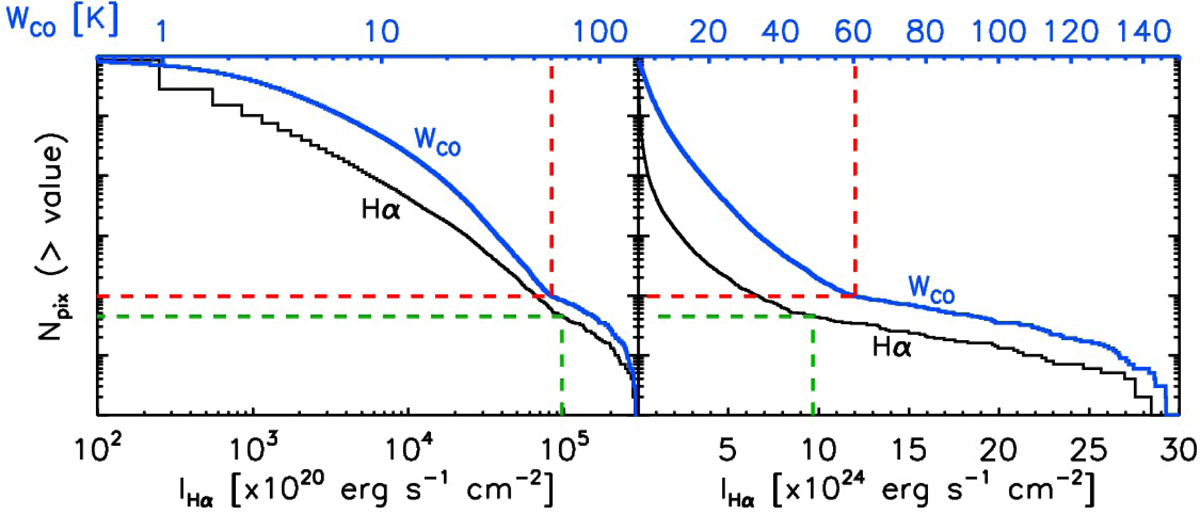
Number of pixels whose integrated Hα intensity IHα (black curve) and integrated CO(2–1) intensity WCO (blue curve) are above the value given in the bottom abscissa for IHα and in the top abscissa for WCO, for the entire galaxy. Left panel: full range of values in logarithmic scale. Right panel: zoomed-in linear scale. The red dashed lines are as in Fig. 1. The green dashed lines show the values corresponding to 45 pixels (or a surface of about ![]() 5) in the Hα map.
5) in the Hα map.
Current usage metrics show cumulative count of Article Views (full-text article views including HTML views, PDF and ePub downloads, according to the available data) and Abstracts Views on Vision4Press platform.
Data correspond to usage on the plateform after 2015. The current usage metrics is available 48-96 hours after online publication and is updated daily on week days.
Initial download of the metrics may take a while.