Fig. 8.
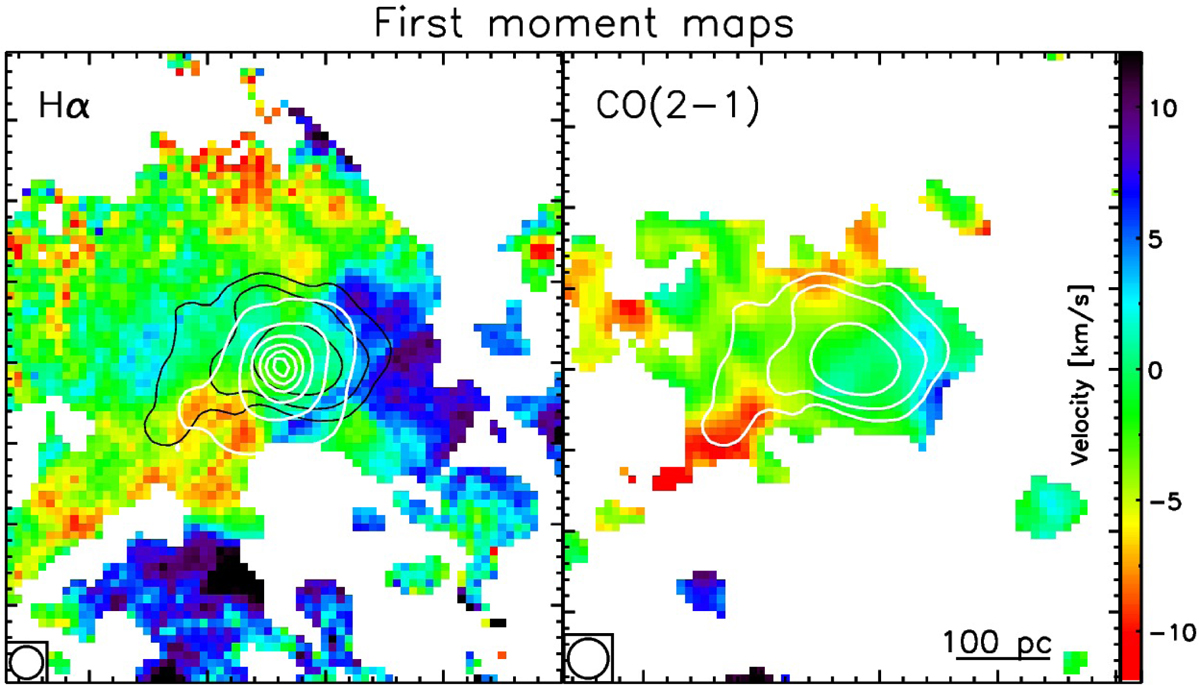
Maps of the velocity centroid of the Hα and CO(2–1) emission for the region surrounding the headlight cloud. The maps are constructed after subtracting a model for the galaxy’s rotation (Lang et al. 2019). The contours correspond to the Hα and CO integrated emission: black (white) contours in the left (right) panel are the CO(2–1) contours, white contours in the left panel are Hα contours. The Hα seeing and the restored CO(2–1) beam are indicated in the bottom left part of each panel.
Current usage metrics show cumulative count of Article Views (full-text article views including HTML views, PDF and ePub downloads, according to the available data) and Abstracts Views on Vision4Press platform.
Data correspond to usage on the plateform after 2015. The current usage metrics is available 48-96 hours after online publication and is updated daily on week days.
Initial download of the metrics may take a while.