Fig. 5.
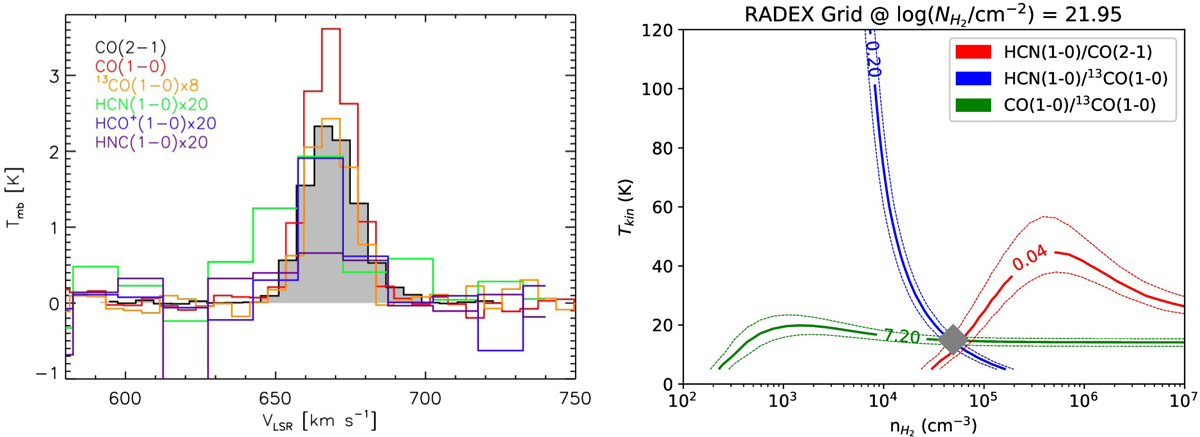
Left: line profiles of all measured molecular gas tracers extracted at the position of the peak emission of each line, after convolving all data to the angular resolution of 13CO(1−0). The CO(2−1) spectrum appears as the gray filled region. Other lines are scaled by the factors indicated in the legend to put them on the same plot. Right: RADEX output showing fits to the observed ratios among these lines. Blue, red and green lines correspond to the observed HCN/13CO, HCN(1−0)/CO(2−1), and 12CO/13CO values. The gray diamond indicates the position on the RADEX [nH2, Tkin] grid where the χ2 is minimal (i.e., the best-fit values). The dashed lines show the 95% confidence level of the χ2 fit, which is smaller than the size of the diamond.
Current usage metrics show cumulative count of Article Views (full-text article views including HTML views, PDF and ePub downloads, according to the available data) and Abstracts Views on Vision4Press platform.
Data correspond to usage on the plateform after 2015. The current usage metrics is available 48-96 hours after online publication and is updated daily on week days.
Initial download of the metrics may take a while.