Fig. B.2.
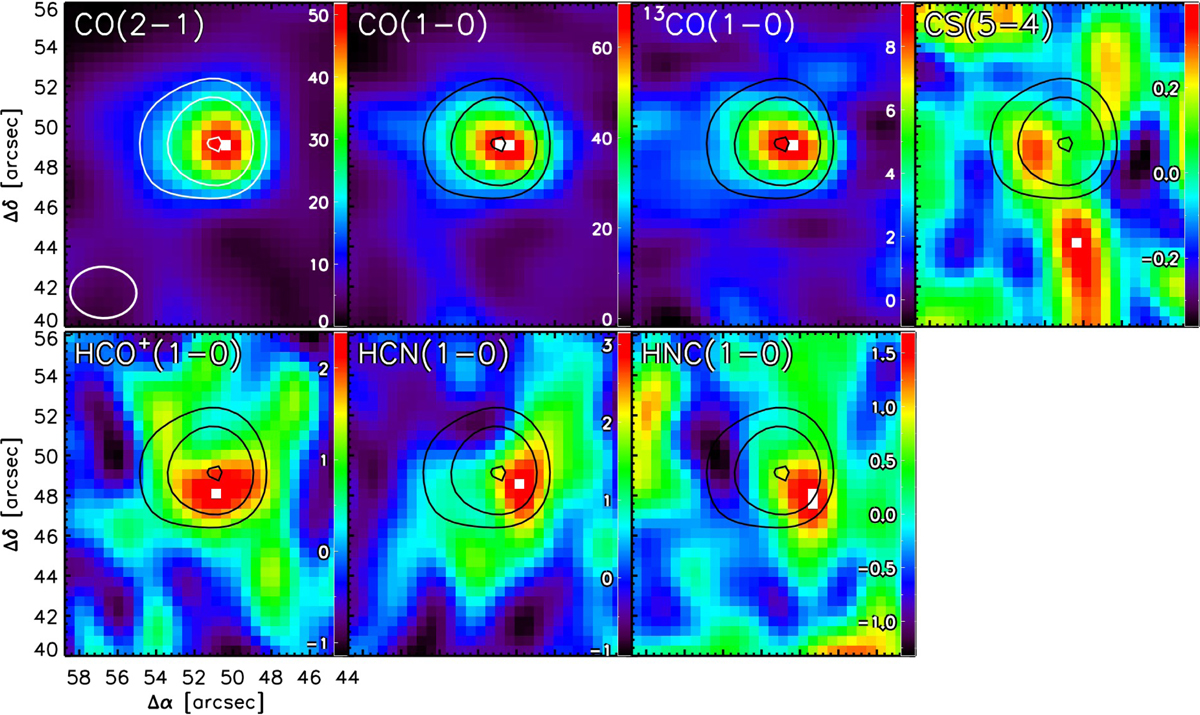
Integrated emission line for the different gas tracers observed with ALMA, convolved to the spatial resolution of 13CO(1−0). The size of the synthesized beam is shown in the bottom left corner of the first panel. The emission for all tracers is integrated between 650 and 685 km s−1; the color bars are in units of K km s−1. The white contours in the first panel (black contours in the other panels) correspond to 15σ, 25σ, 50σ, and 100σ, with σ = 1.01 K km s−1 of the CO(2–1) line. Offset positions are from the galactic center.
Current usage metrics show cumulative count of Article Views (full-text article views including HTML views, PDF and ePub downloads, according to the available data) and Abstracts Views on Vision4Press platform.
Data correspond to usage on the plateform after 2015. The current usage metrics is available 48-96 hours after online publication and is updated daily on week days.
Initial download of the metrics may take a while.