Fig. B.1.
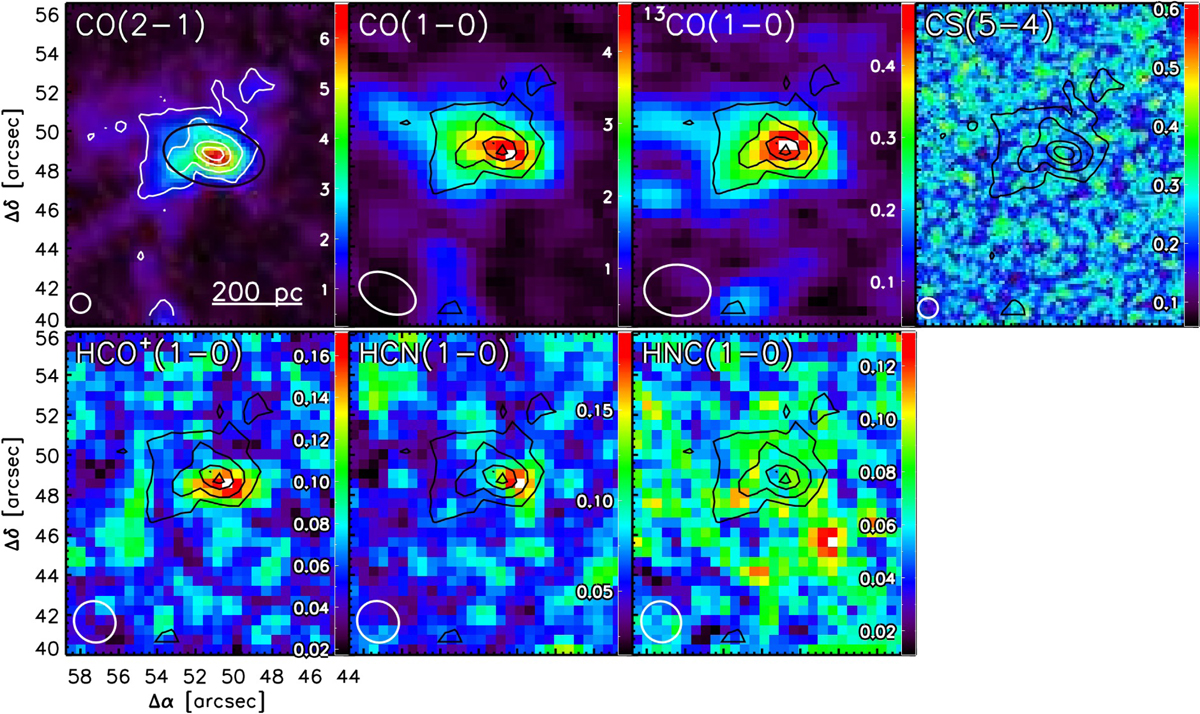
Peak temperature for the different gas tracers observed with ALMA. The size of the synthesized beam is shown in the bottom left corner of each panel. The color bars are in units of kelvin. The white contours in the first panel (black contours in the other panels) correspond to the 20%, 40%, 70%, and 90% of the CO(2–1) peak temperature. Top left panel: headlight cloud as identified by CPROPS (black ellipse). Offset positions are from the galactic center.
Current usage metrics show cumulative count of Article Views (full-text article views including HTML views, PDF and ePub downloads, according to the available data) and Abstracts Views on Vision4Press platform.
Data correspond to usage on the plateform after 2015. The current usage metrics is available 48-96 hours after online publication and is updated daily on week days.
Initial download of the metrics may take a while.