Fig. 10.
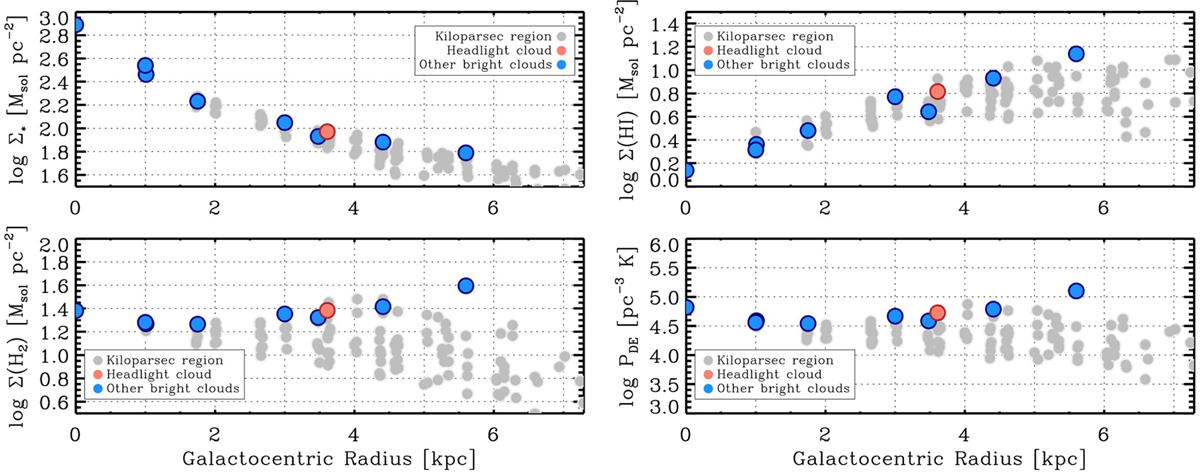
Headlight cloud in galactic context. Panels display the average surface density of stellar mass (top left), atomic gas (top right), molecular gas (bottom left), and estimated dynamical equilibrium pressure (bottom right) as a function of the galactocentric radius in kiloparsec-sized apertures that cover the galaxy (from Sun et al., in prep.). The gray points show all apertures, and the colored points show apertures that host one of the ten brightest clouds in the galaxy (red: headlight cloud, blue: another bright cloud). The vertical spread of points at a fixed radius indicates azimuthal variations.
Current usage metrics show cumulative count of Article Views (full-text article views including HTML views, PDF and ePub downloads, according to the available data) and Abstracts Views on Vision4Press platform.
Data correspond to usage on the plateform after 2015. The current usage metrics is available 48-96 hours after online publication and is updated daily on week days.
Initial download of the metrics may take a while.