Fig. 1.
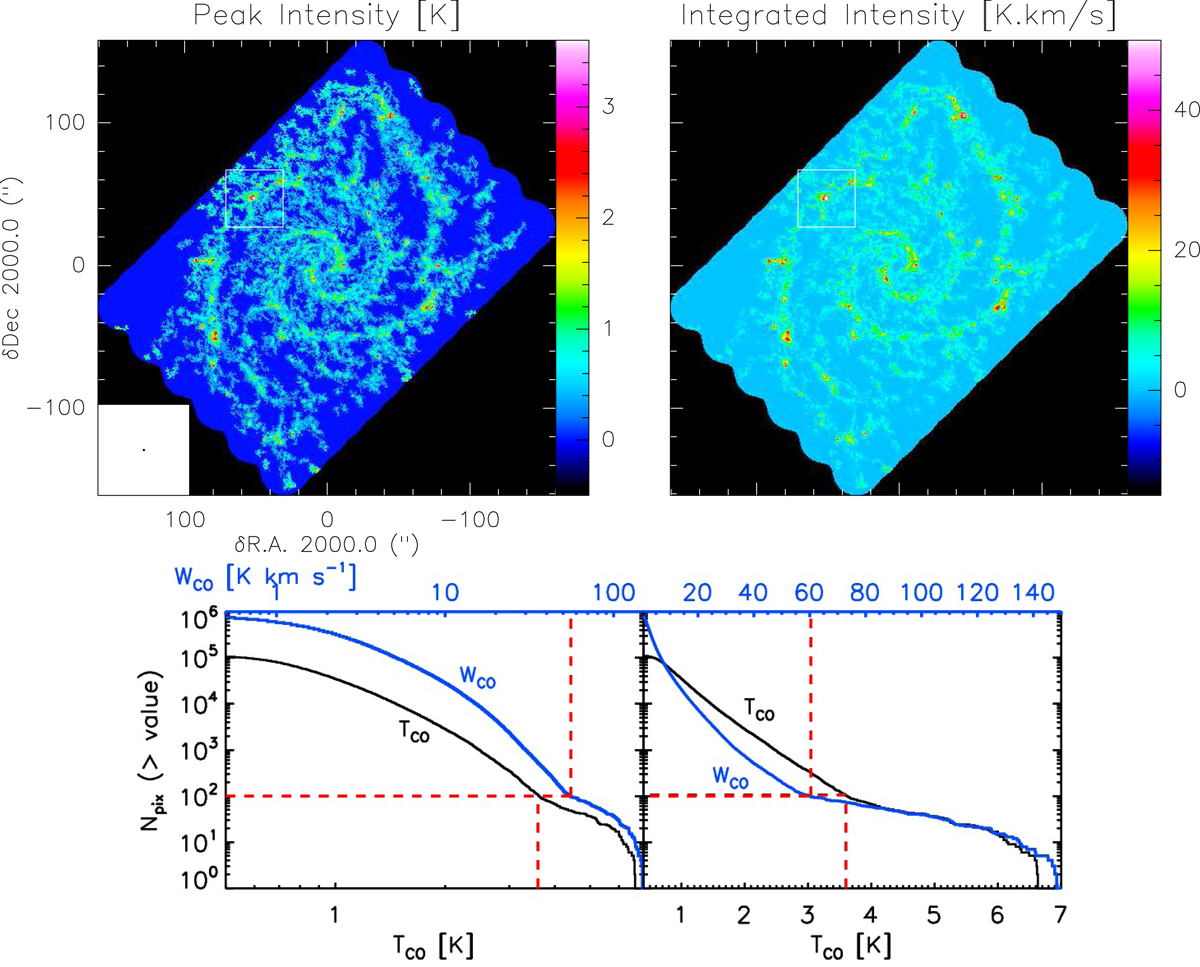
Top: spatial distribution of the peak temperature (left) and integrated intensity (right) of the CO(2–1) line over the full observed field of view of NGC 628. The color scales a dynamic range of the peak temperature and integrated intensity, saturated to high intensity of 3.6 K and 45 K km s−1, respectively. The white square shows the position of the headlight cloud in NGC 628 (see the left part of Fig. 2 for a magnification). Offset positions are from the galactic center, α: 01h36m41![]() 72, δ: +15°46′59
72, δ: +15°46′59![]() 3 J2000. The beamsize is shown in the bottom left corner of the left panel. Bottom: number of pixels whose CO(2–1) peak temperature TCO (black curve) and integrated CO(2–1) intensity WCO (blue curve) are above the value given in the bottom abscissa for TCO and in the top abscissa for WCO, for the entire galaxy. Shown is the full range of values in logarithmic scale (left) and the zoomed-in linear scale (right). The red dashed lines show the values corresponding to 100 pixels (or a surface of about 2″ × 2″) in the CO map.
3 J2000. The beamsize is shown in the bottom left corner of the left panel. Bottom: number of pixels whose CO(2–1) peak temperature TCO (black curve) and integrated CO(2–1) intensity WCO (blue curve) are above the value given in the bottom abscissa for TCO and in the top abscissa for WCO, for the entire galaxy. Shown is the full range of values in logarithmic scale (left) and the zoomed-in linear scale (right). The red dashed lines show the values corresponding to 100 pixels (or a surface of about 2″ × 2″) in the CO map.
Current usage metrics show cumulative count of Article Views (full-text article views including HTML views, PDF and ePub downloads, according to the available data) and Abstracts Views on Vision4Press platform.
Data correspond to usage on the plateform after 2015. The current usage metrics is available 48-96 hours after online publication and is updated daily on week days.
Initial download of the metrics may take a while.