Fig. 8.
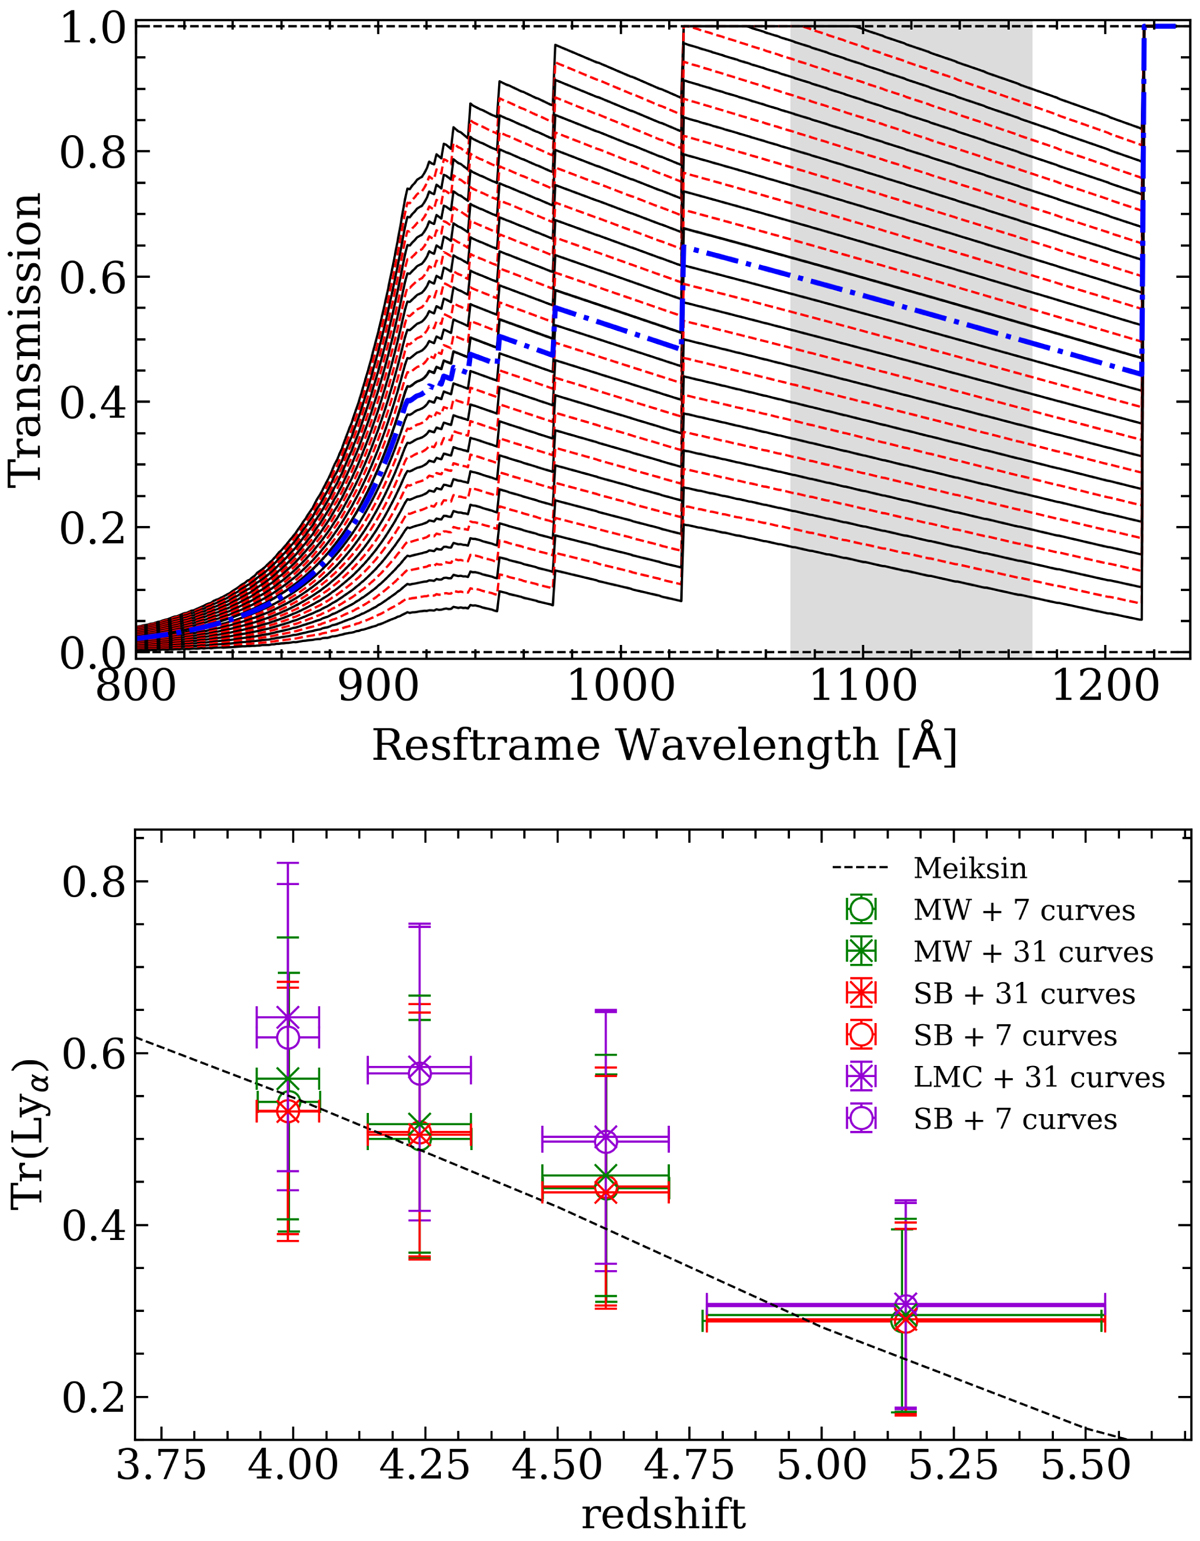
Top: intergalactic medium transmission at z = 4 in the case where we finely sample the IGM templates and consider 31 transmission curves instead of 7. The blue curve shows the average M06 prescription and the grey region locates the region where we measure Tr(Lyα). Bottom: comparison of the Tr(Lyα) in the cases where we use 7 curves or 31 curves.
Current usage metrics show cumulative count of Article Views (full-text article views including HTML views, PDF and ePub downloads, according to the available data) and Abstracts Views on Vision4Press platform.
Data correspond to usage on the plateform after 2015. The current usage metrics is available 48-96 hours after online publication and is updated daily on week days.
Initial download of the metrics may take a while.