Fig. 6.
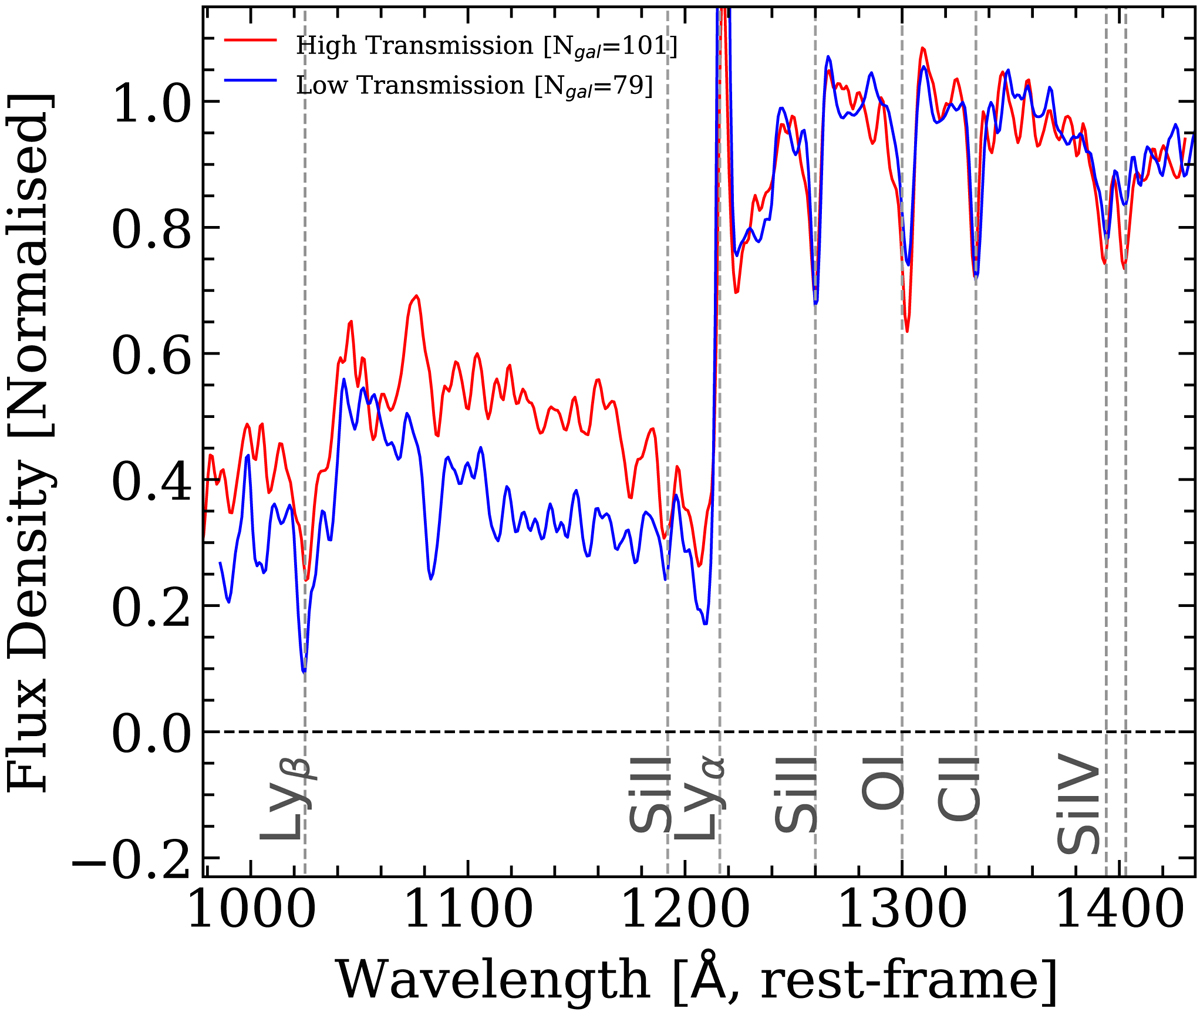
Averaged spectra. We display two stack spectra. In blue we show the average of all the spectra (79) with IGM transmission lower than the mean. The mean redshift in these spectrum is ∼4.36. In red we show the average of all the spectra (101) with IGM transmission higher than the mean, with a mean redshift of ∼4.60. The stack spectra have been made with the specstack program (Thomas 2019a).
Current usage metrics show cumulative count of Article Views (full-text article views including HTML views, PDF and ePub downloads, according to the available data) and Abstracts Views on Vision4Press platform.
Data correspond to usage on the plateform after 2015. The current usage metrics is available 48-96 hours after online publication and is updated daily on week days.
Initial download of the metrics may take a while.