Fig. 5.
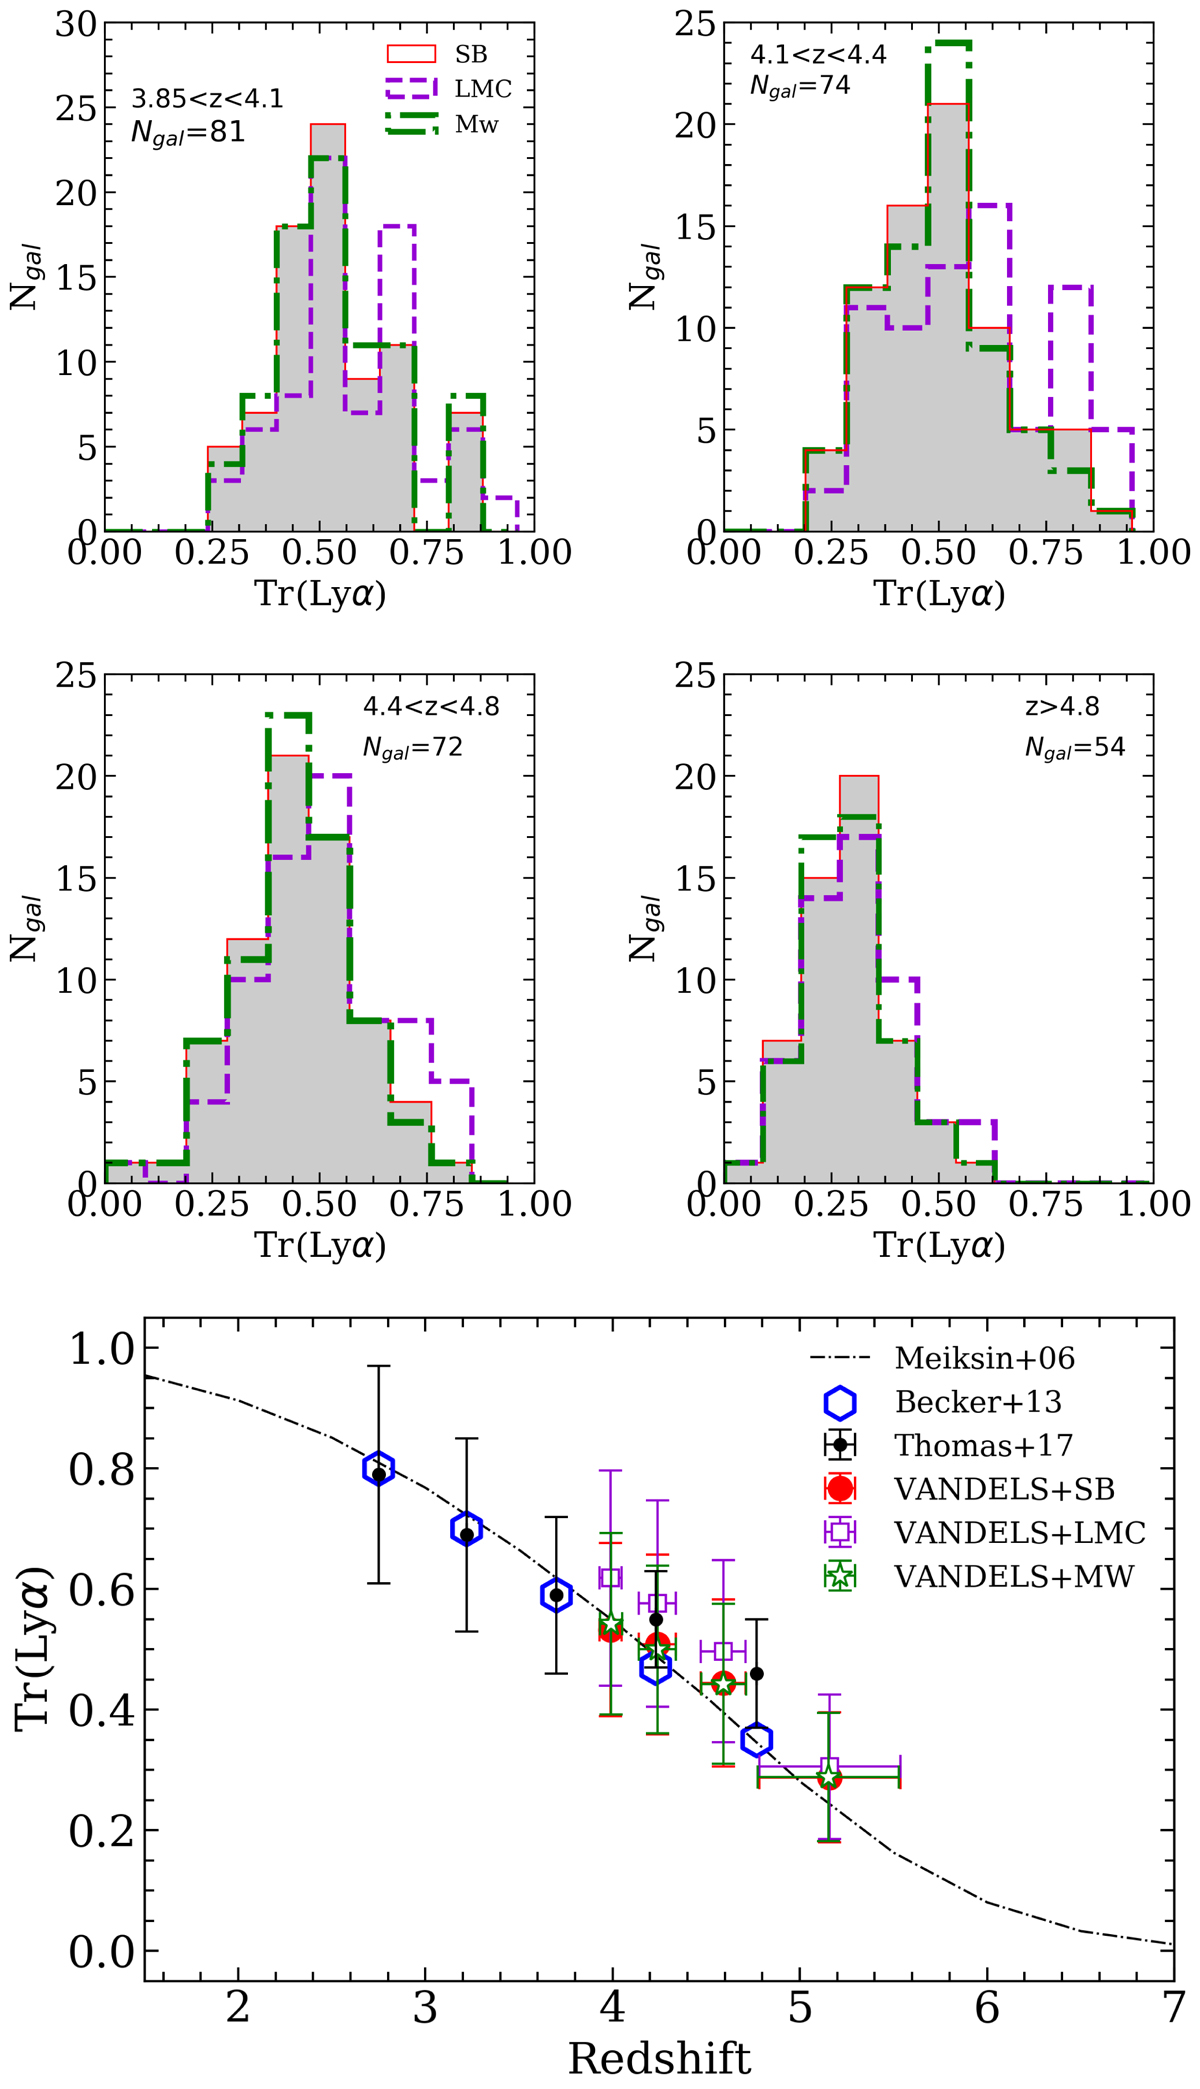
Lyman α transmission (Tr(Lyα)) as a function of redshift. The top four first small plots show the distributions of the transmission in four redshift bins 3.85 < z < 4.1, 4.1 < z < 4.4, 4.4 < z < 4.8, and z > 4.8 for each dust prescription. We indicate the number of galaxies entering in the distribution in each of these plots. The bottom plots display the evolution of the transmission with redshift. Our measurements are indicated in red for SB, green for MW, and violet for LMC. We show the measurements for QSOs in blue from Becker et al. (2013), measurements for high redshift galaxies from the VIMOS Ultra Deep Survey (VUDS, Thomas et al. 2017a, in black), and the theoretical prediction from Meiksin (2006) represented with the black dashed line.
Current usage metrics show cumulative count of Article Views (full-text article views including HTML views, PDF and ePub downloads, according to the available data) and Abstracts Views on Vision4Press platform.
Data correspond to usage on the plateform after 2015. The current usage metrics is available 48-96 hours after online publication and is updated daily on week days.
Initial download of the metrics may take a while.