Fig. 3.
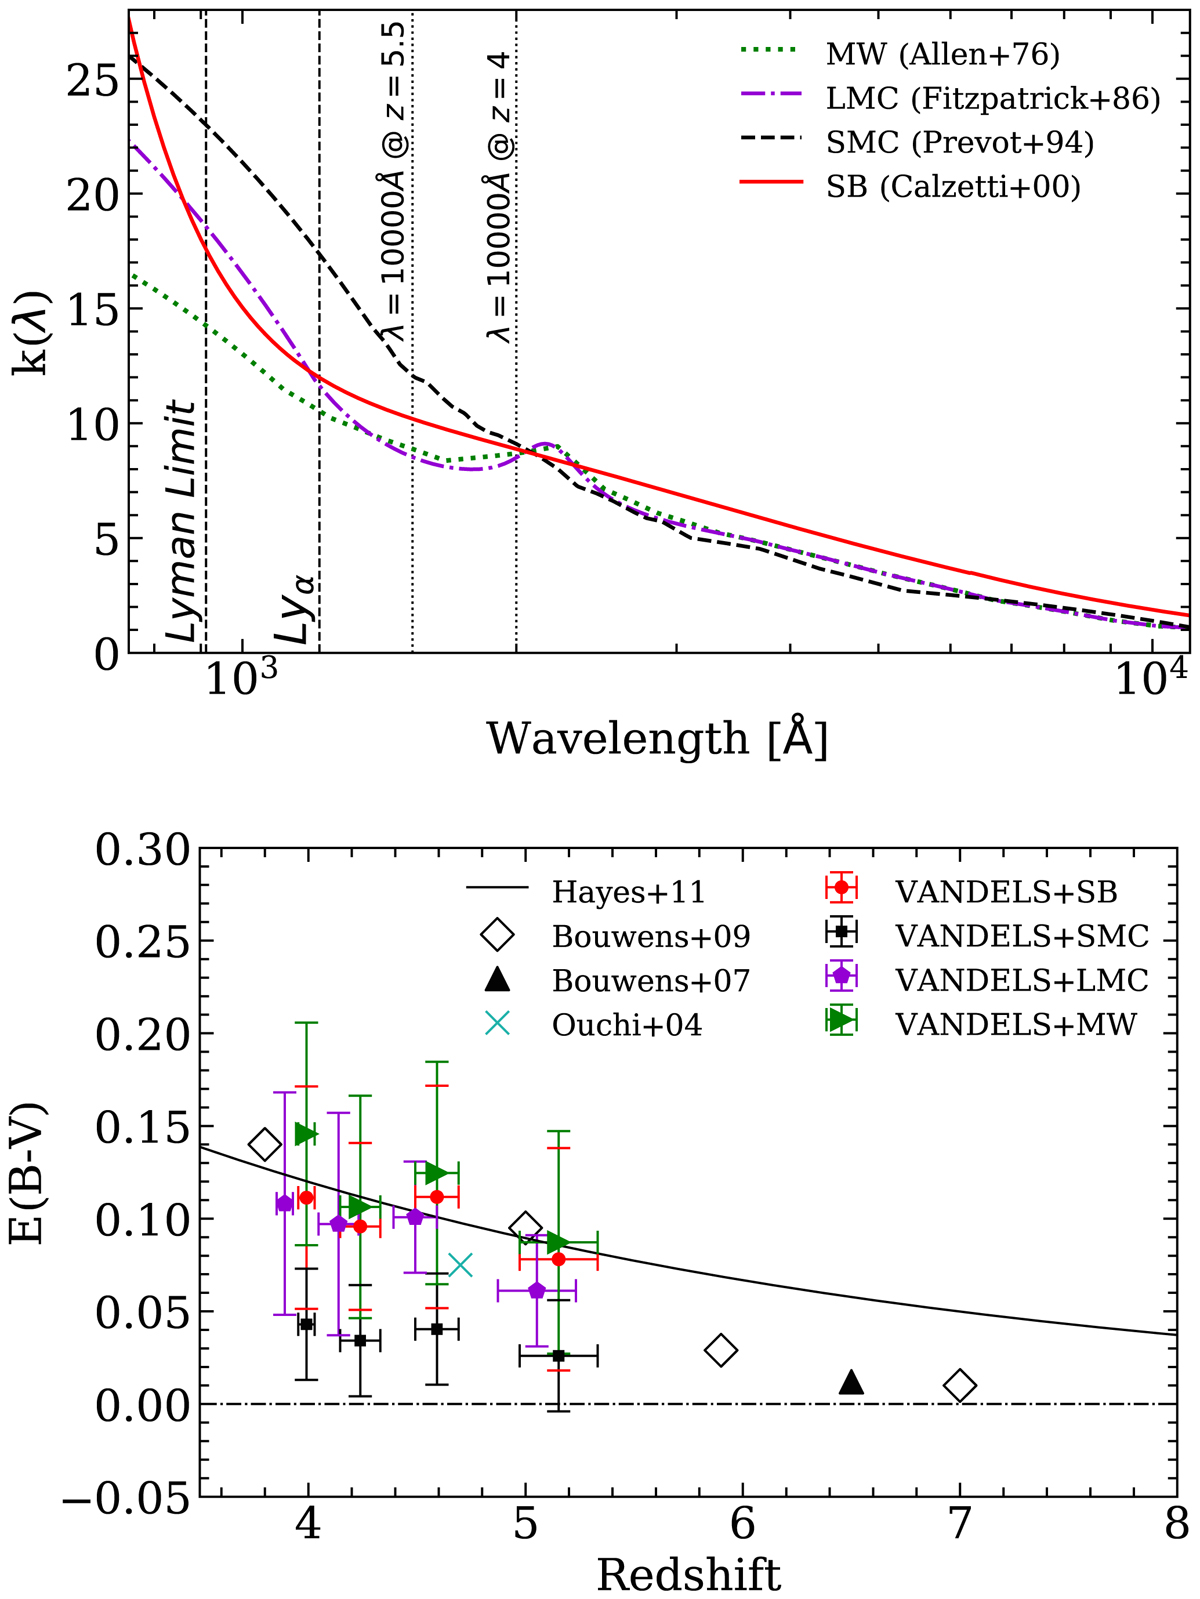
Dust evolution from our 281 galaxies. Top panel: four different dust prescriptions used to estimate the dust extinction in our sample. In red we show the prescription from Calzetti et al. (2000), in black the prescription from Prevot et al. (1984) for the SMC, in violet the prescription from Fitzpatrick (1986) for the LMC, and in green for the Milky Way prescription by Allen (1976). Bottom panel: evolution with redshift of the dust attenuation in our selected sample of 281 galaxies from the photometric fitting for the four dust prescriptions shown in the top panel. Measurements report the mean and median absolute deviation for both the redshift and the E(B − V) values. We compare our results with previous measurements found in the literature at similar redshifts. The empty black diamonds are estimations from Bouwens et al. (2009), black triangles those from Bouwens et al. (2007), and light blue crosses show those from Ouchi et al. (2004). The dashed black line shows a fit from Hayes et al. (2011). We note that all the VANDELS estimations are at the same redshift; violet ones have been slightly shifted for clarity.
Current usage metrics show cumulative count of Article Views (full-text article views including HTML views, PDF and ePub downloads, according to the available data) and Abstracts Views on Vision4Press platform.
Data correspond to usage on the plateform after 2015. The current usage metrics is available 48-96 hours after online publication and is updated daily on week days.
Initial download of the metrics may take a while.