Free Access
Fig. 2.
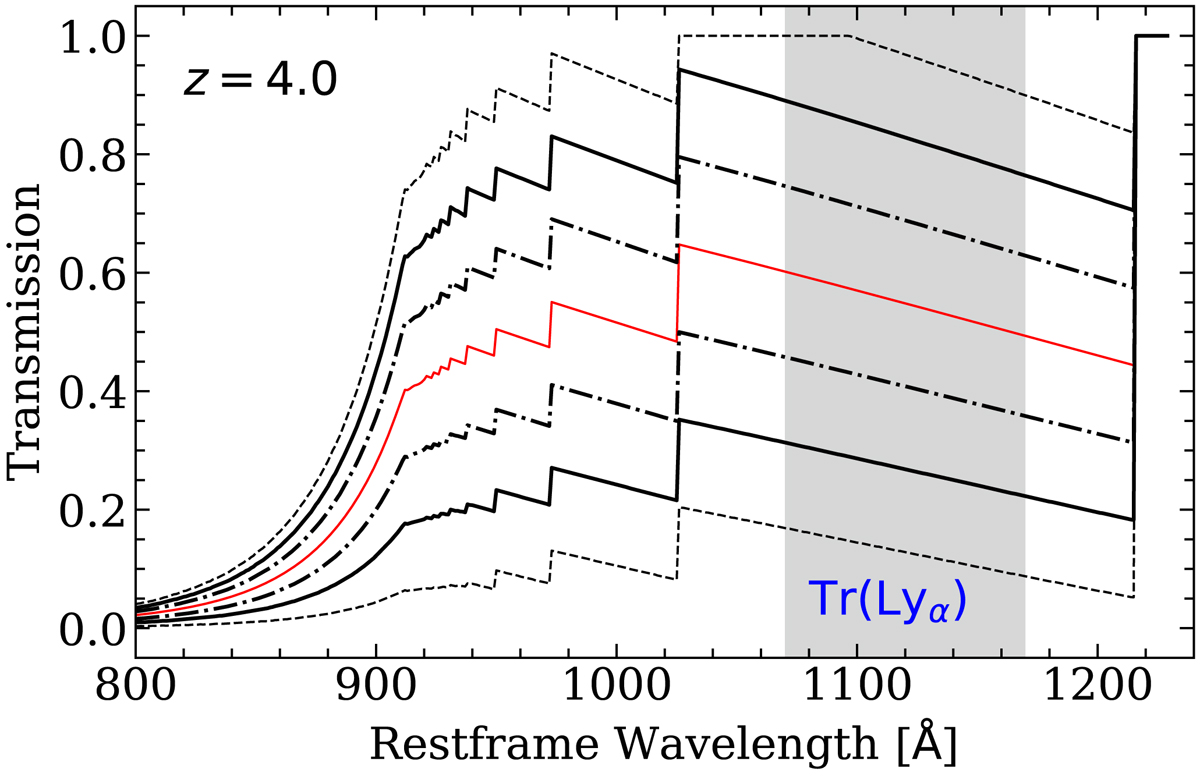
Example of IGM transmission curves at z = 4.0. The red curve is from M06 Prescription while the black curves represent the augmented prescription from Thomas et al. (2017a). The latter allows us to span possible transmission from ∼15% to ∼90% at this redshift. The grey area shows where we compute the Lyα transmission.
Current usage metrics show cumulative count of Article Views (full-text article views including HTML views, PDF and ePub downloads, according to the available data) and Abstracts Views on Vision4Press platform.
Data correspond to usage on the plateform after 2015. The current usage metrics is available 48-96 hours after online publication and is updated daily on week days.
Initial download of the metrics may take a while.