Open Access
Fig. 4.
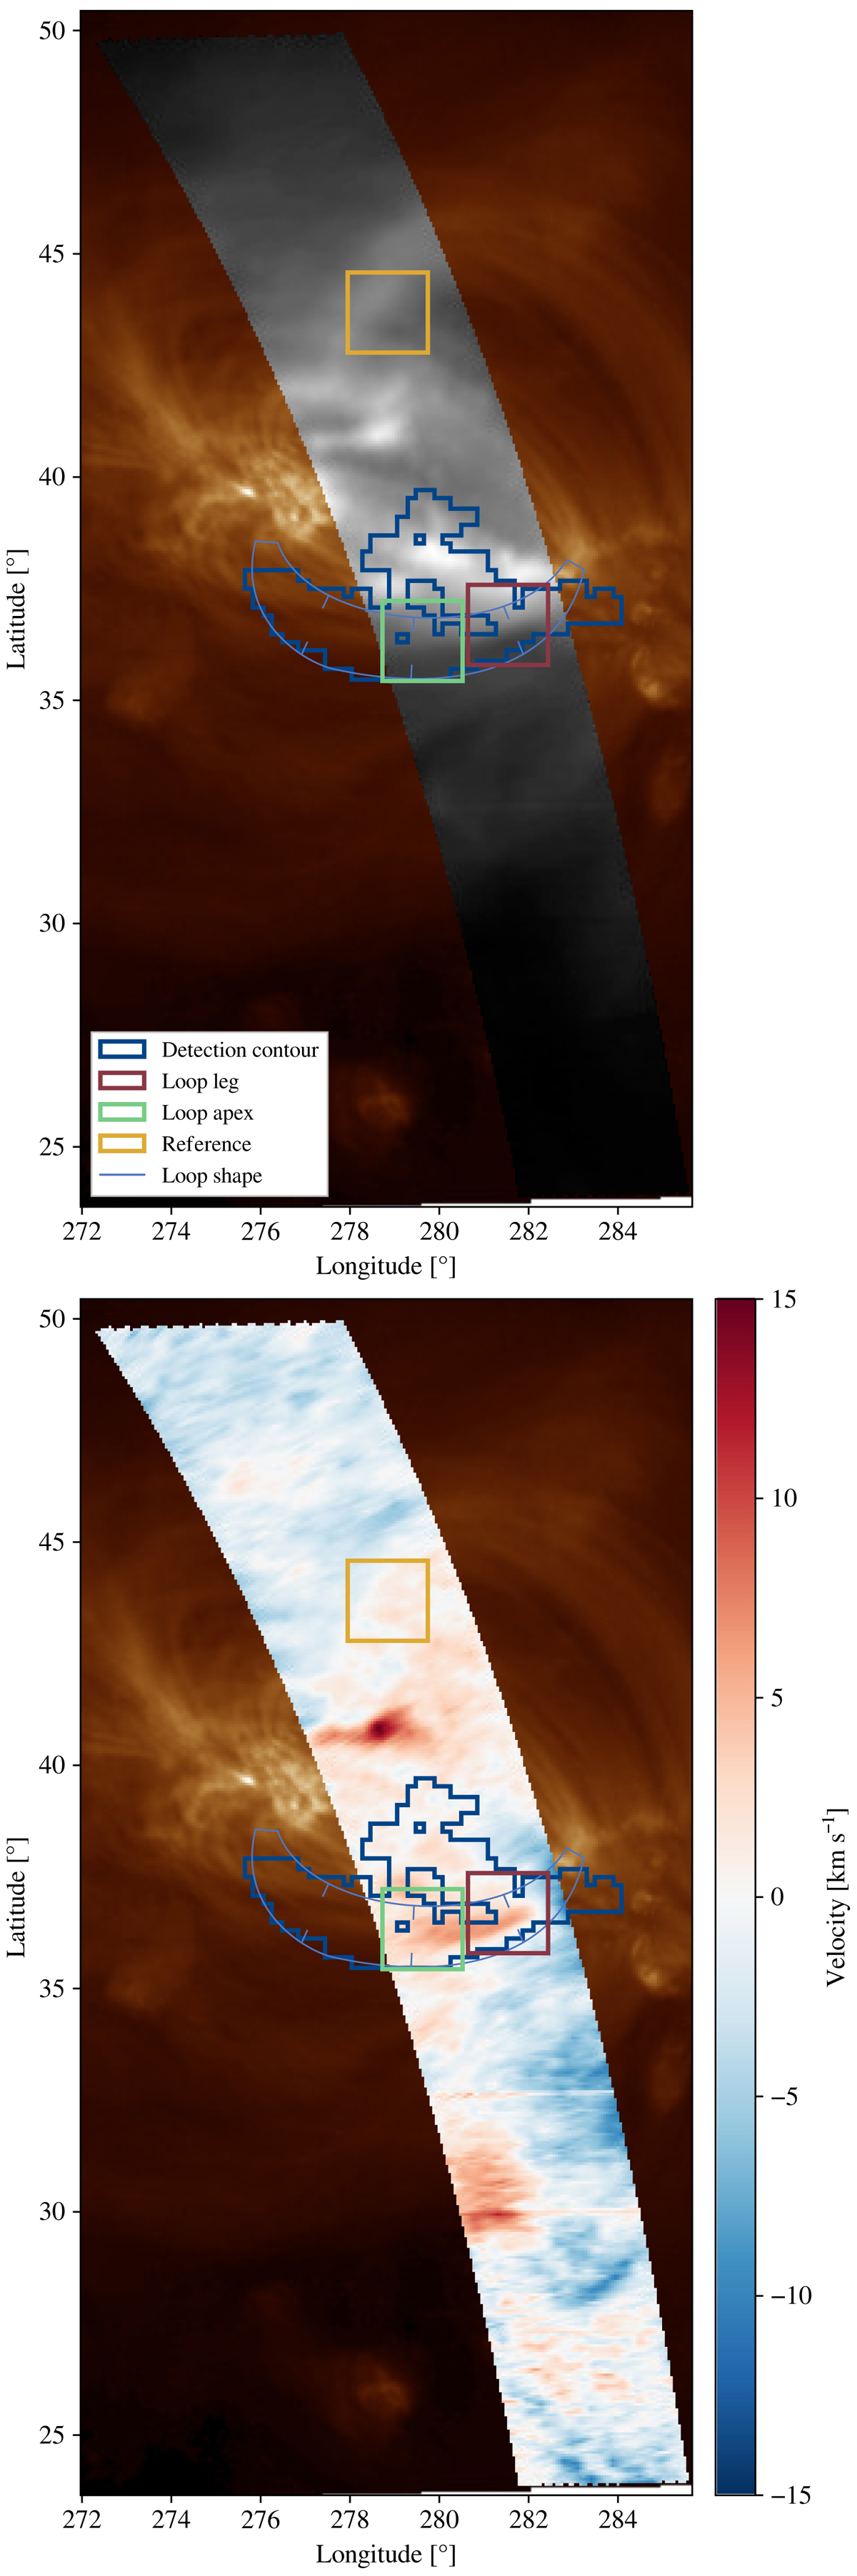
Same as Fig. 1, but with the FOV of raster eis_l0_20101103_211534 from dataset 8, acquired on 2010 November 3 between 21:15 UT and 21:20 UT. Both maps are overlaid on a AIA 193 Å map to help visualize the structure of the active region. The temporal evolution of AIA 193 Å can be seen in the online movie.
Current usage metrics show cumulative count of Article Views (full-text article views including HTML views, PDF and ePub downloads, according to the available data) and Abstracts Views on Vision4Press platform.
Data correspond to usage on the plateform after 2015. The current usage metrics is available 48-96 hours after online publication and is updated daily on week days.
Initial download of the metrics may take a while.