Fig. 3.
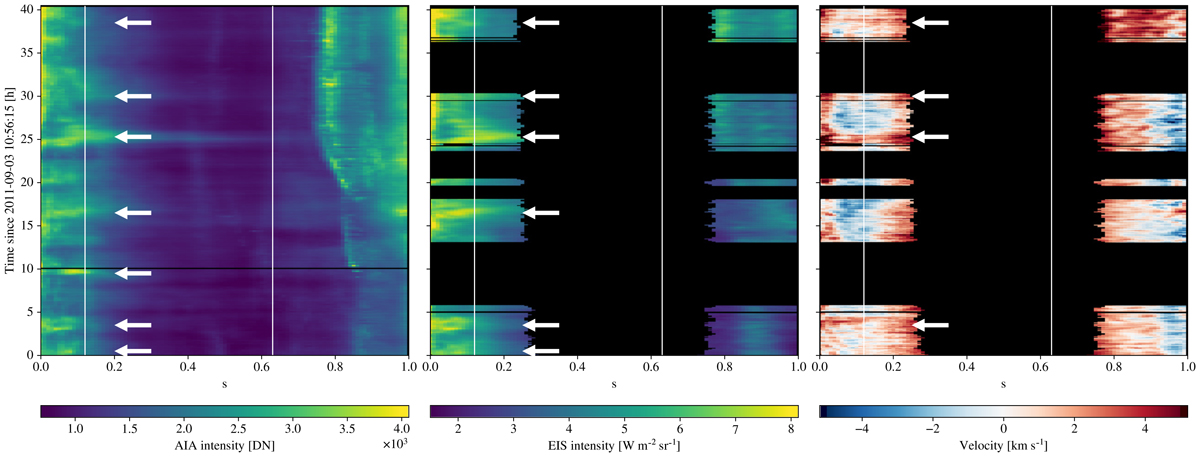
Evolution of the AIA 193 Å intensity (left), EIS Fe XII 195.119 Å intensity (middle), and velocity (right), as a function of the position along the loop shape of dataset 1 defined in Fig. 1, and of time. s = 0 corresponds to the eastern footpoint, and the values are averaged over the loop width. Each row of the EIS plots (middle and right) corresponds to a different raster of the dataset. The vertical lines show the limits of the AIA detection contour, and the arrows correspond to the peaks marked in Fig. 2.
Current usage metrics show cumulative count of Article Views (full-text article views including HTML views, PDF and ePub downloads, according to the available data) and Abstracts Views on Vision4Press platform.
Data correspond to usage on the plateform after 2015. The current usage metrics is available 48-96 hours after online publication and is updated daily on week days.
Initial download of the metrics may take a while.