Fig. 2.
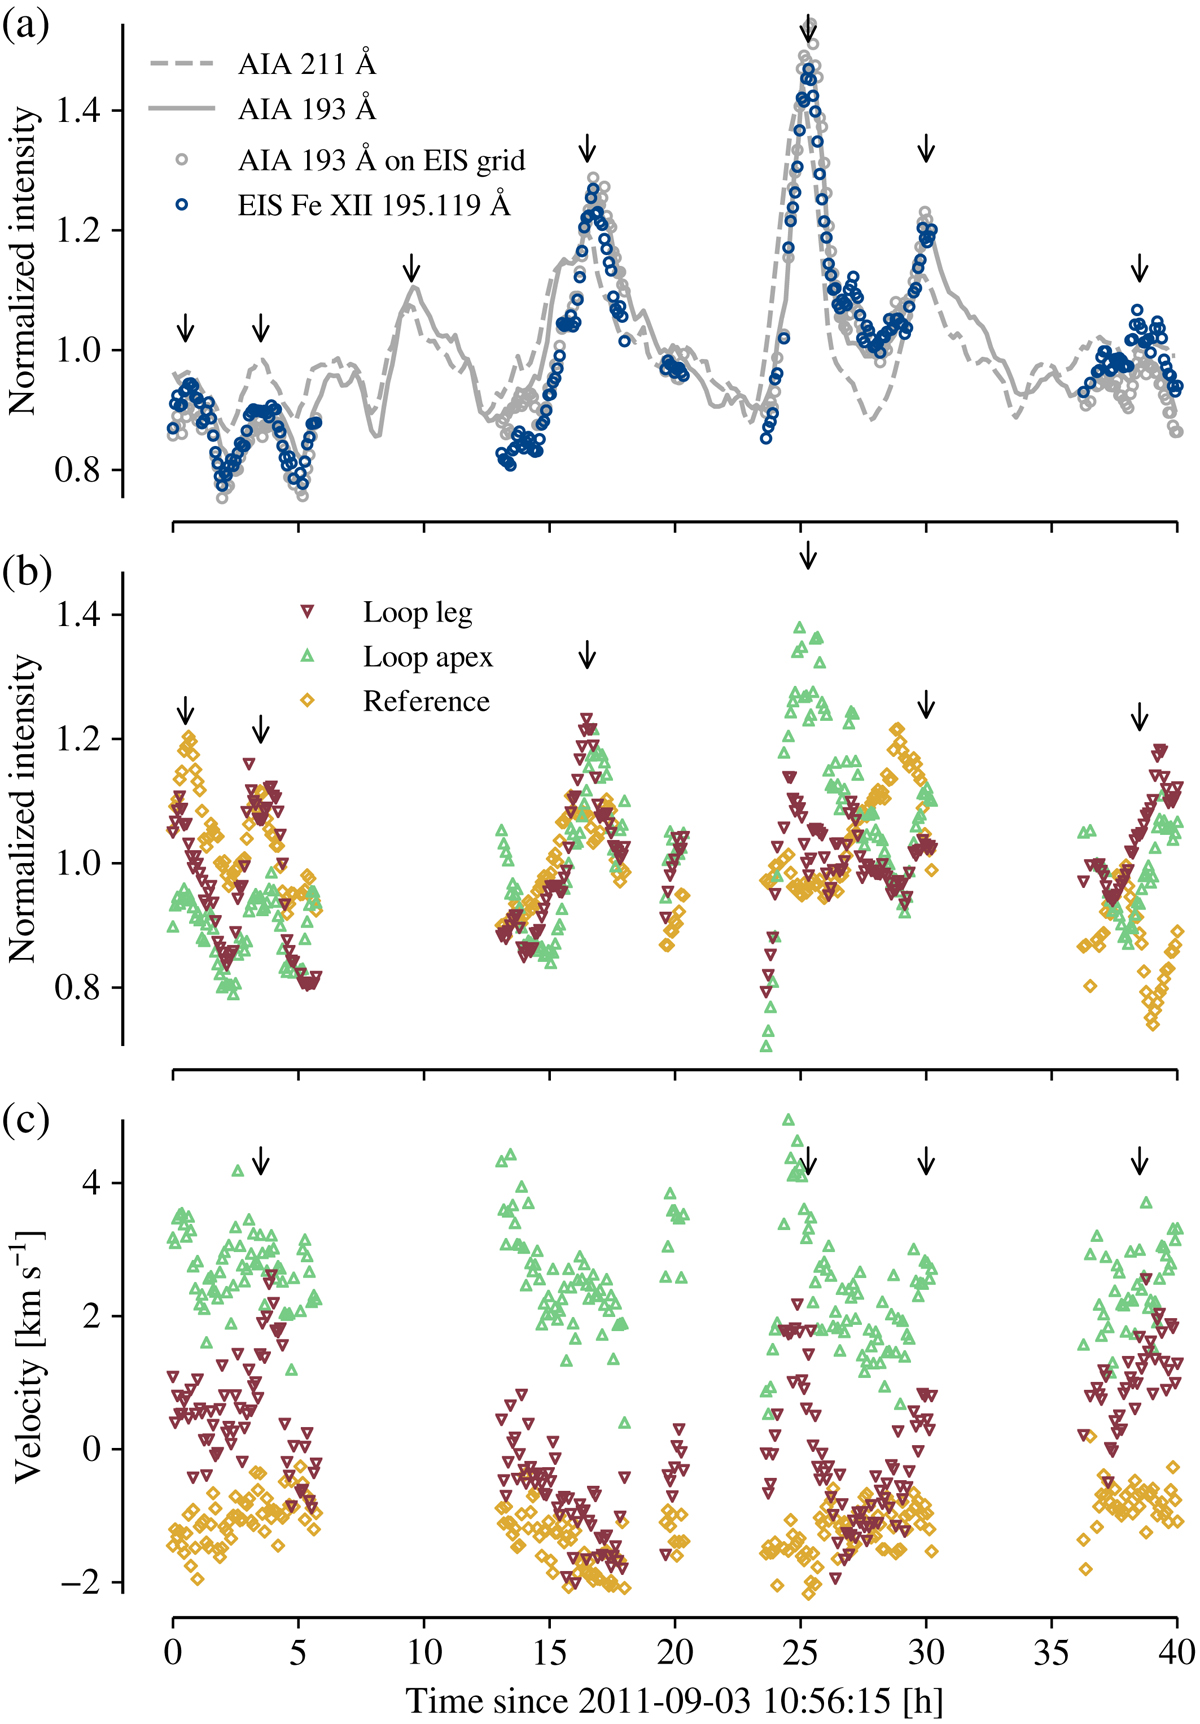
Time series of the intensity and velocity for dataset 1, averaged in the contours defined in Fig. 1. (a) Comparison of intensities in the detection contour: EIS Fe XII 195.119 Å (![]() ), full resolution AIA 211 Å (
), full resolution AIA 211 Å (![]() ) and 193 Å (
) and 193 Å (![]() ), and AIA 193 Å sampled at the same locations as the EIS rasters (
), and AIA 193 Å sampled at the same locations as the EIS rasters (![]() ). (b) EIS Fe XII 195.119 Å intensity normalized to (
). (b) EIS Fe XII 195.119 Å intensity normalized to (![]() 5.6,
5.6, ![]() 3.9, and
3.9, and ![]() 3.5) W m−2 sr−1. (c) Velocity corrected for the EIS orbital drift. The arrows mark the positions of the peaks described in the text.
3.5) W m−2 sr−1. (c) Velocity corrected for the EIS orbital drift. The arrows mark the positions of the peaks described in the text.
Current usage metrics show cumulative count of Article Views (full-text article views including HTML views, PDF and ePub downloads, according to the available data) and Abstracts Views on Vision4Press platform.
Data correspond to usage on the plateform after 2015. The current usage metrics is available 48-96 hours after online publication and is updated daily on week days.
Initial download of the metrics may take a while.