Fig. A.2.
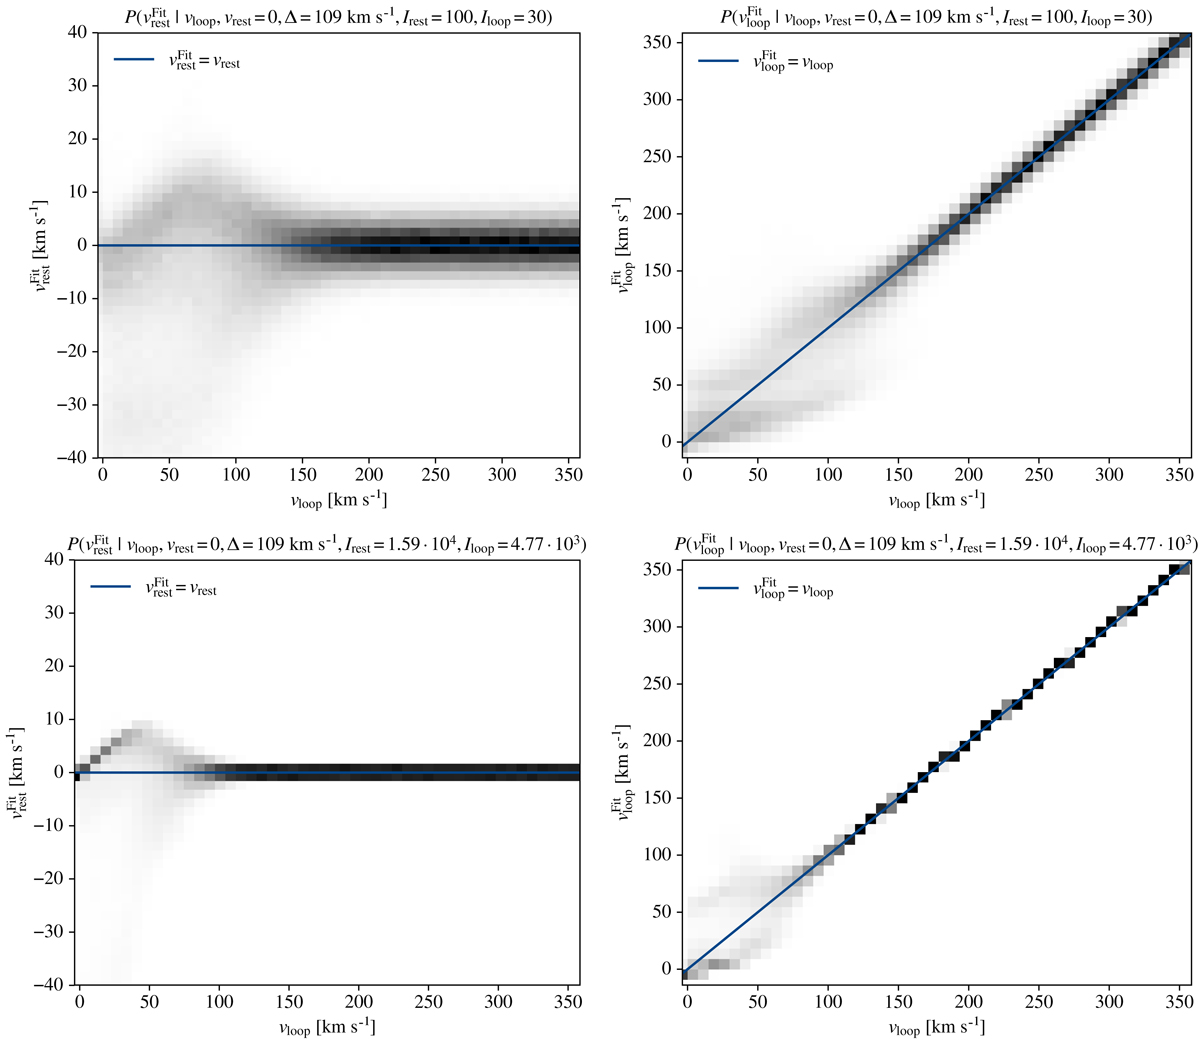
Stacked histograms for the fit of the double-gaussian function G2 to synthetic 2-lines EIS spectra. Left column: dependency of ![]() on vloop, and right column: dependency of
on vloop, and right column: dependency of ![]() on vloop. Top row: S/N of 10, bottom row: S/N of 126. All spectra used for these plots had an intensity ratio Iloop/Irest of 30%. The blue lines mark to the input position of the corresponding line (i.e., vrest or vloop). Black bins corresponds to higher probabilities.
on vloop. Top row: S/N of 10, bottom row: S/N of 126. All spectra used for these plots had an intensity ratio Iloop/Irest of 30%. The blue lines mark to the input position of the corresponding line (i.e., vrest or vloop). Black bins corresponds to higher probabilities.
Current usage metrics show cumulative count of Article Views (full-text article views including HTML views, PDF and ePub downloads, according to the available data) and Abstracts Views on Vision4Press platform.
Data correspond to usage on the plateform after 2015. The current usage metrics is available 48-96 hours after online publication and is updated daily on week days.
Initial download of the metrics may take a while.