Fig. A.1.
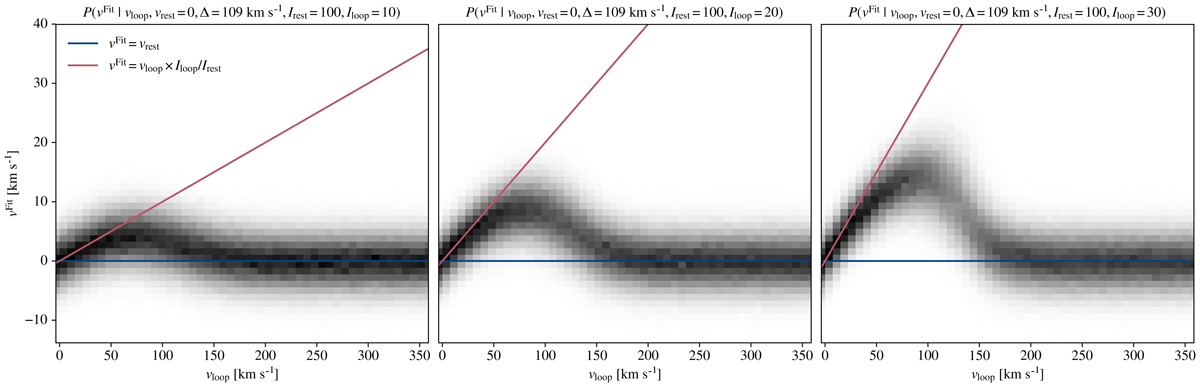
Stacked histograms showing dependency of vFit on vloop, for the fit of the single-gaussian function G1 to synthetic 2-lines EIS spectra. The three plots correspond to a S/N of 10, with (from left to right) intensity ratios Iloop/Irest of 10%, 20%, and 30%. The blue lines represent the input position of the bright line and the red lines show the empirical relation vFit = vloop × Iloop/Irest. Black bins corresponds to higher probabilities.
Current usage metrics show cumulative count of Article Views (full-text article views including HTML views, PDF and ePub downloads, according to the available data) and Abstracts Views on Vision4Press platform.
Data correspond to usage on the plateform after 2015. The current usage metrics is available 48-96 hours after online publication and is updated daily on week days.
Initial download of the metrics may take a while.