Fig. 10.
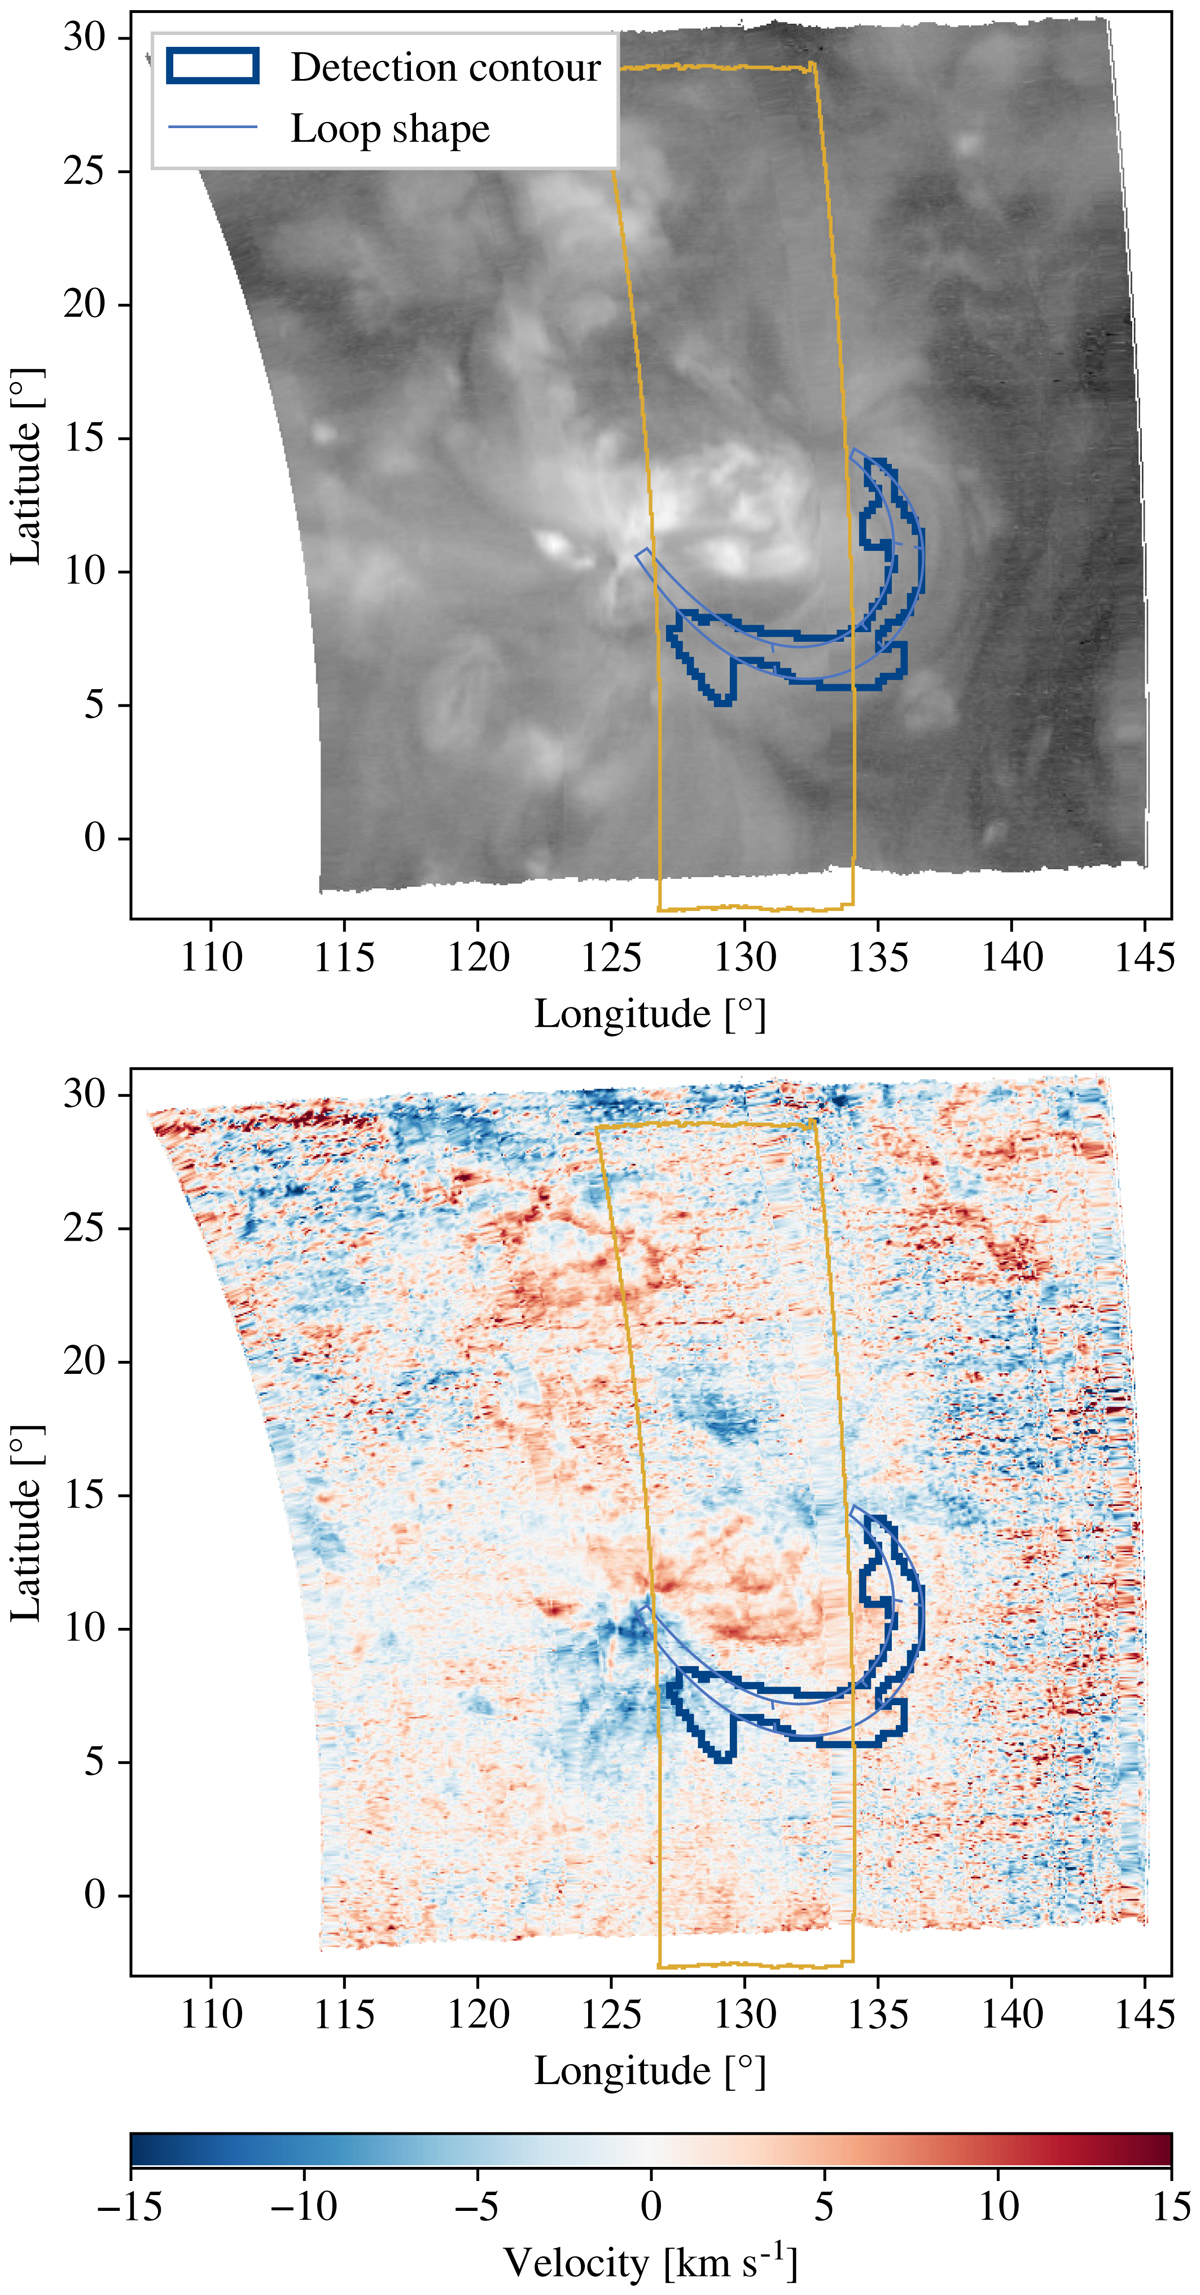
Same as Fig. 1, but with the FOV of raster eis_l0_20140810_042212 from dataset 11, acquired on 2014 August 10 between 04:22 UT and 05:29 UT. The AIA detection contour is shown in dark blue, the loop shape in light blue, and the FOV of raster eis_l0_20140810_192924 is shown in yellow. The temporal evolution of AIA 193 Å can be seen in the online movie.
Current usage metrics show cumulative count of Article Views (full-text article views including HTML views, PDF and ePub downloads, according to the available data) and Abstracts Views on Vision4Press platform.
Data correspond to usage on the plateform after 2015. The current usage metrics is available 48-96 hours after online publication and is updated daily on week days.
Initial download of the metrics may take a while.