Fig. 1.
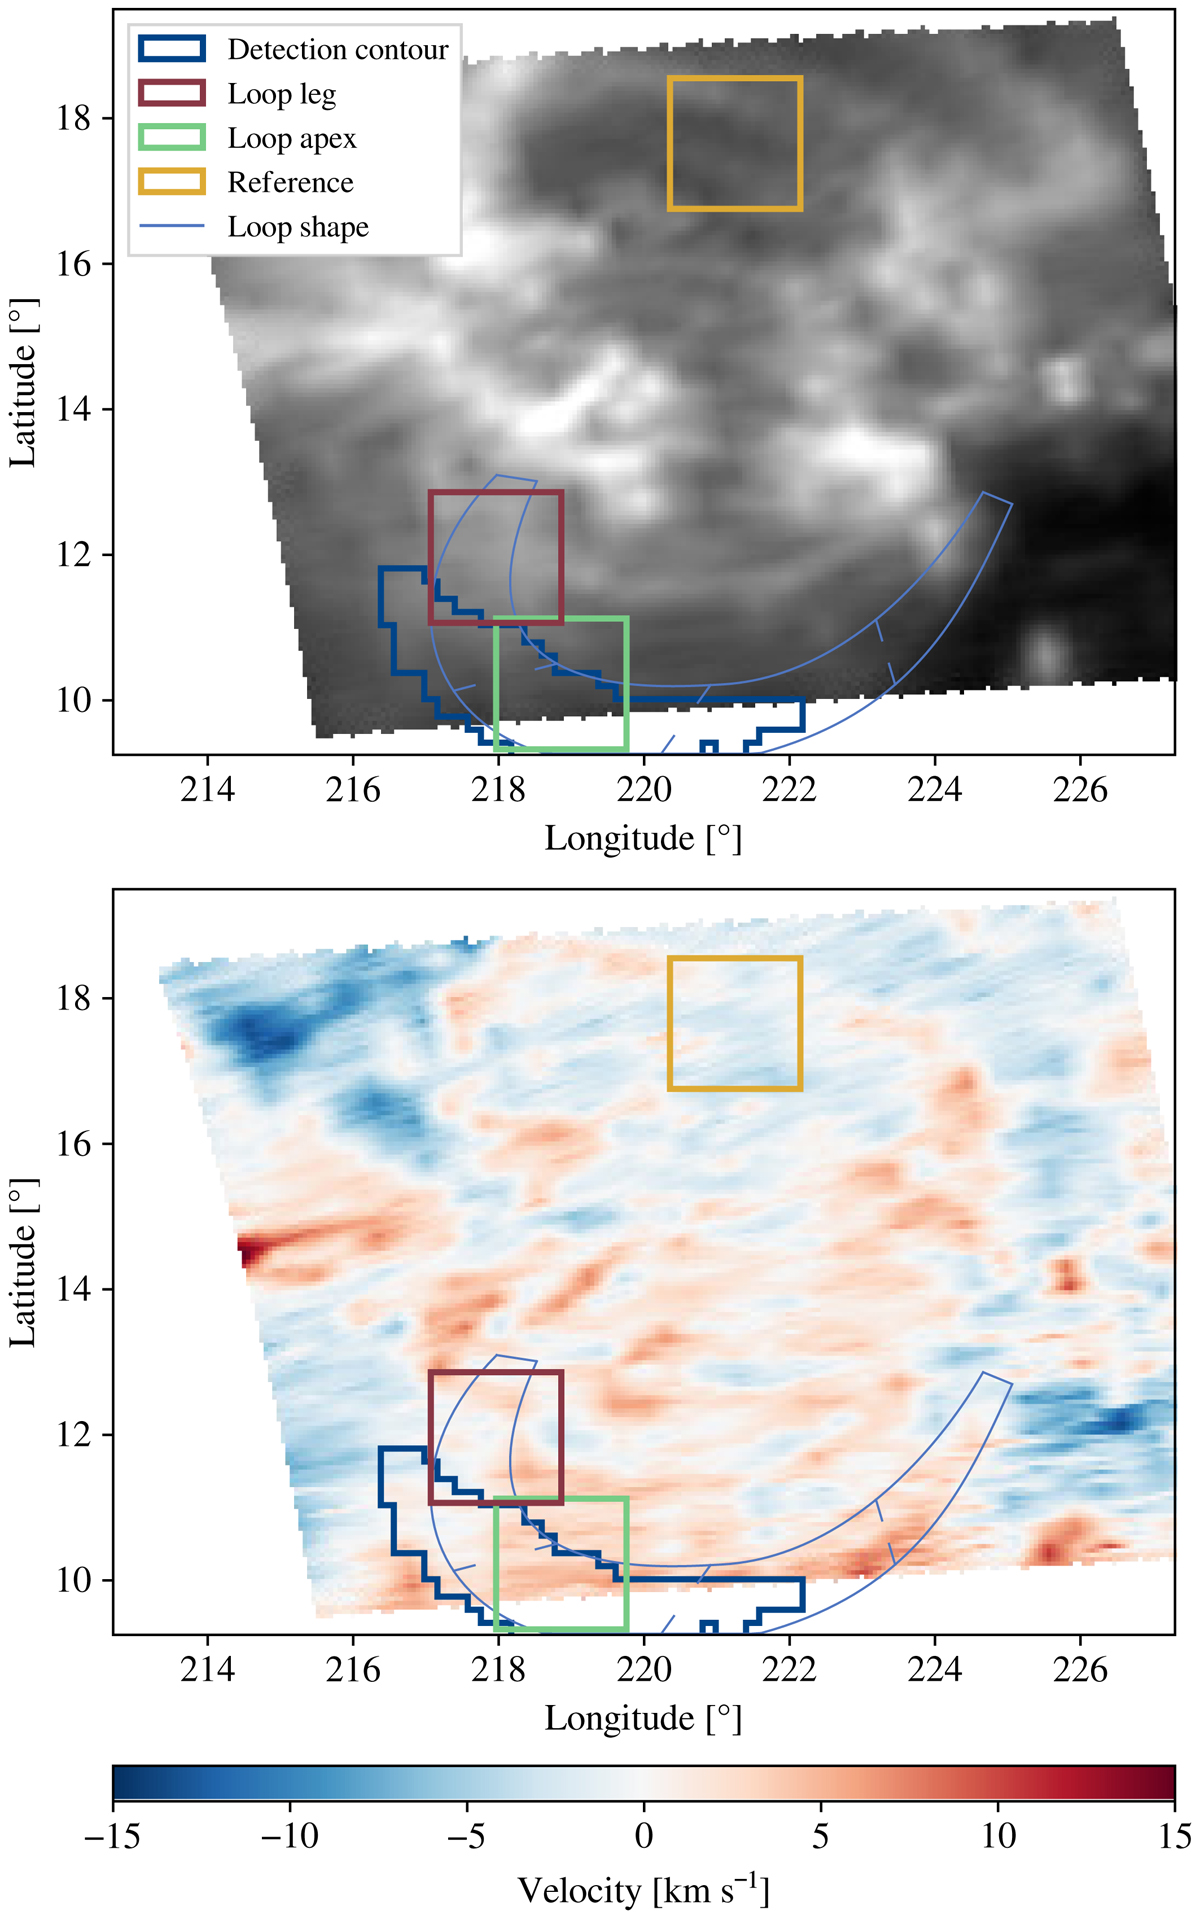
Maps of the Fe XII 195.119 Å line emission (top) and velocity (bottom) for raster eis_l0_20110903_105615 from dataset 1, projected onto Carrington coordinates. This raster was acquired on 2011 September 3 between 10:56 UT and 11:01 UT. Several regions of interest are represented on the map: the contour in which intensity pulsations are detected with AIA 193 Å (blue), the contour selected for the loop leg (red), the contour selected for the loop apex (green), a reference contour outside the loop (yellow), and the shape of the underlying loop (light blue). The temporal evolution of AIA 193 Å can be seen in the online movie.
Current usage metrics show cumulative count of Article Views (full-text article views including HTML views, PDF and ePub downloads, according to the available data) and Abstracts Views on Vision4Press platform.
Data correspond to usage on the plateform after 2015. The current usage metrics is available 48-96 hours after online publication and is updated daily on week days.
Initial download of the metrics may take a while.