Fig. 2.
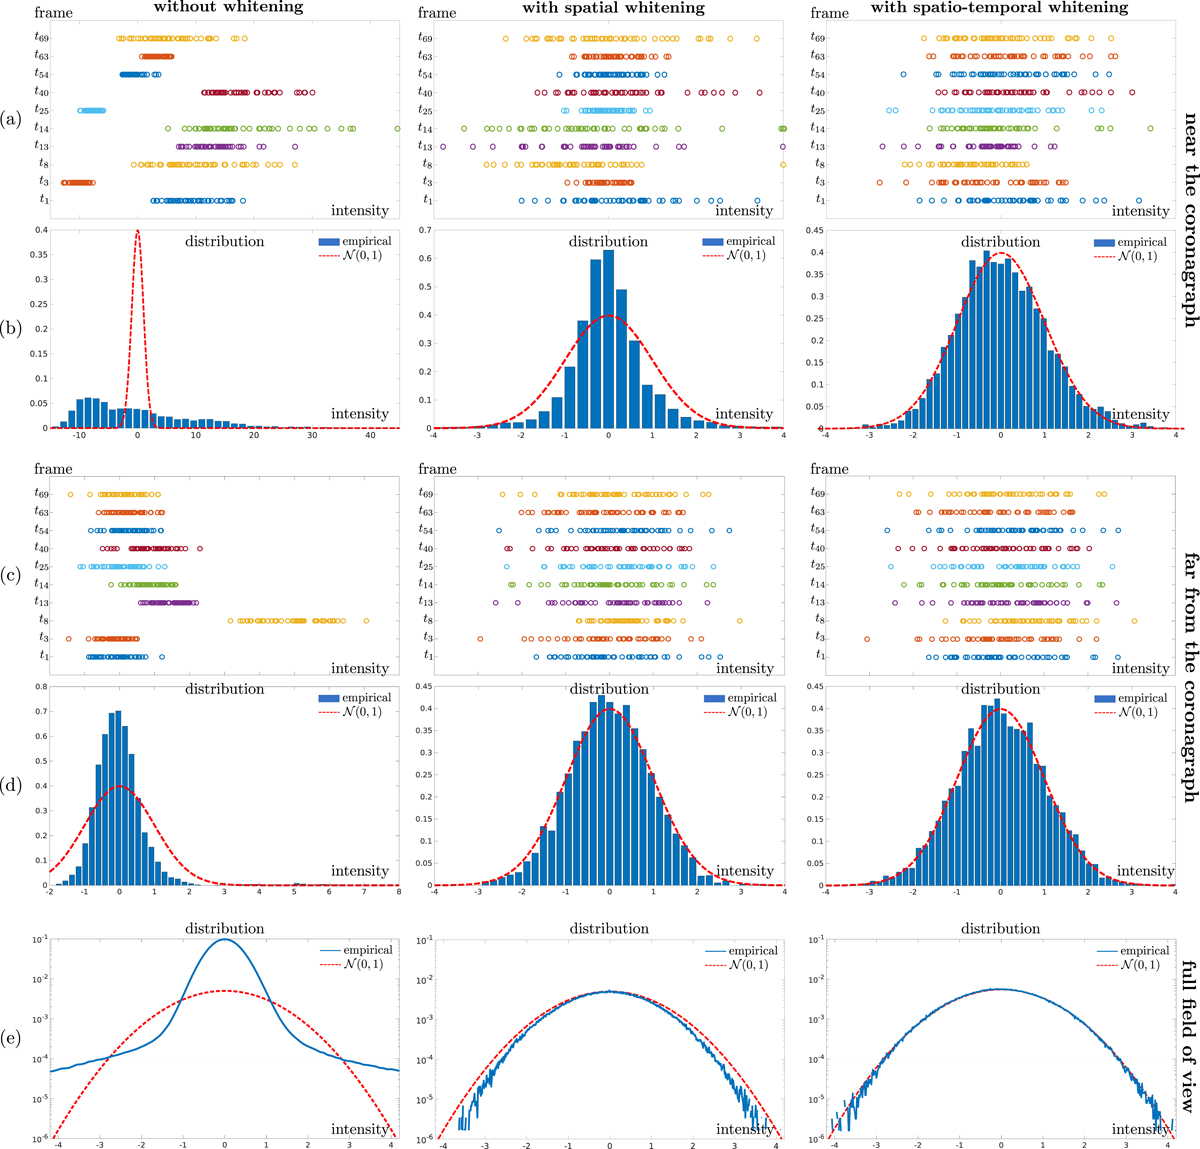
Temporal evolution and empirical distribution of the intensities within a patch: (a)–(b) in patches extracted at a location θk close to the coronagraph; (c)–(d) in patches extracted at a location θk farther from the coronagraph; (e) in all the patches from the field of view. Rows a and c: values within the patches for ten specific frames: t1, t3, t8, t13, t14, t25, t40, t54, t63 and t69. Rows b, d, and e: empirical histograms computed over all frames t1 to t69 and, in dashed line, a standard Gaussian. The first column corresponds to centered patches ![]() . The second column corresponds to centered patches, after whitening the spatial correlations. The last column corresponds to centered patches that have been both whitened for the spatial correlations and equalized with the temporal scaling factors.
. The second column corresponds to centered patches, after whitening the spatial correlations. The last column corresponds to centered patches that have been both whitened for the spatial correlations and equalized with the temporal scaling factors.
Current usage metrics show cumulative count of Article Views (full-text article views including HTML views, PDF and ePub downloads, according to the available data) and Abstracts Views on Vision4Press platform.
Data correspond to usage on the plateform after 2015. The current usage metrics is available 48-96 hours after online publication and is updated daily on week days.
Initial download of the metrics may take a while.