Open Access
Fig. 1.
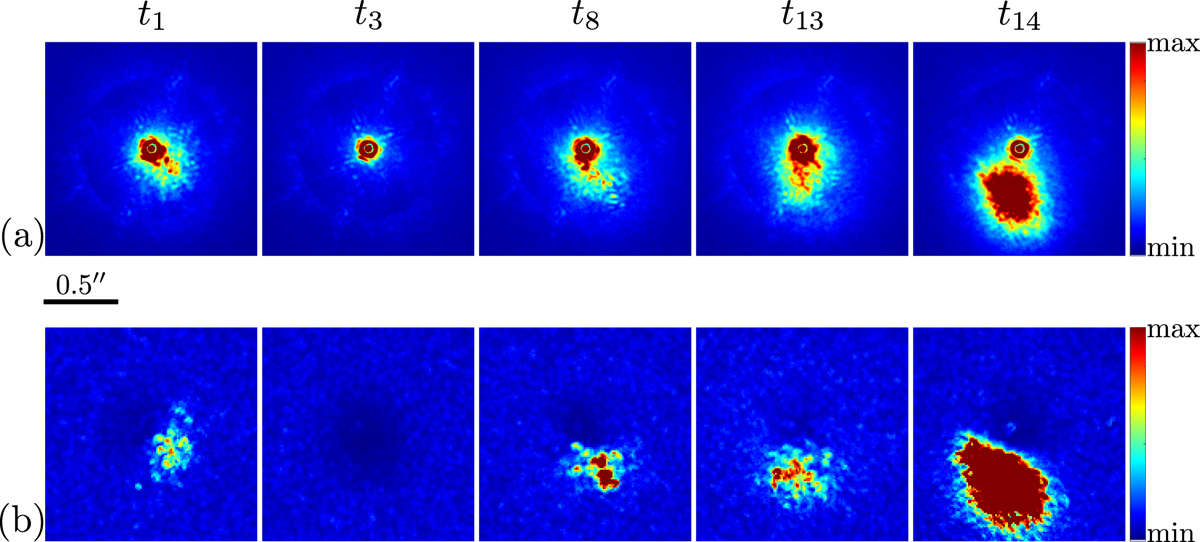
Central region of SPHERE-IRDIS images of HIP 72192: panel a: measured intensity for five selected frames showing strong temporal fluctuations; panel b: map of the estimated temporal scaling parameters ![]() for the matching frames: ℓ = 1, 3, 8, 13 and 14.
for the matching frames: ℓ = 1, 3, 8, 13 and 14.
Current usage metrics show cumulative count of Article Views (full-text article views including HTML views, PDF and ePub downloads, according to the available data) and Abstracts Views on Vision4Press platform.
Data correspond to usage on the plateform after 2015. The current usage metrics is available 48-96 hours after online publication and is updated daily on week days.
Initial download of the metrics may take a while.