Fig. 8.
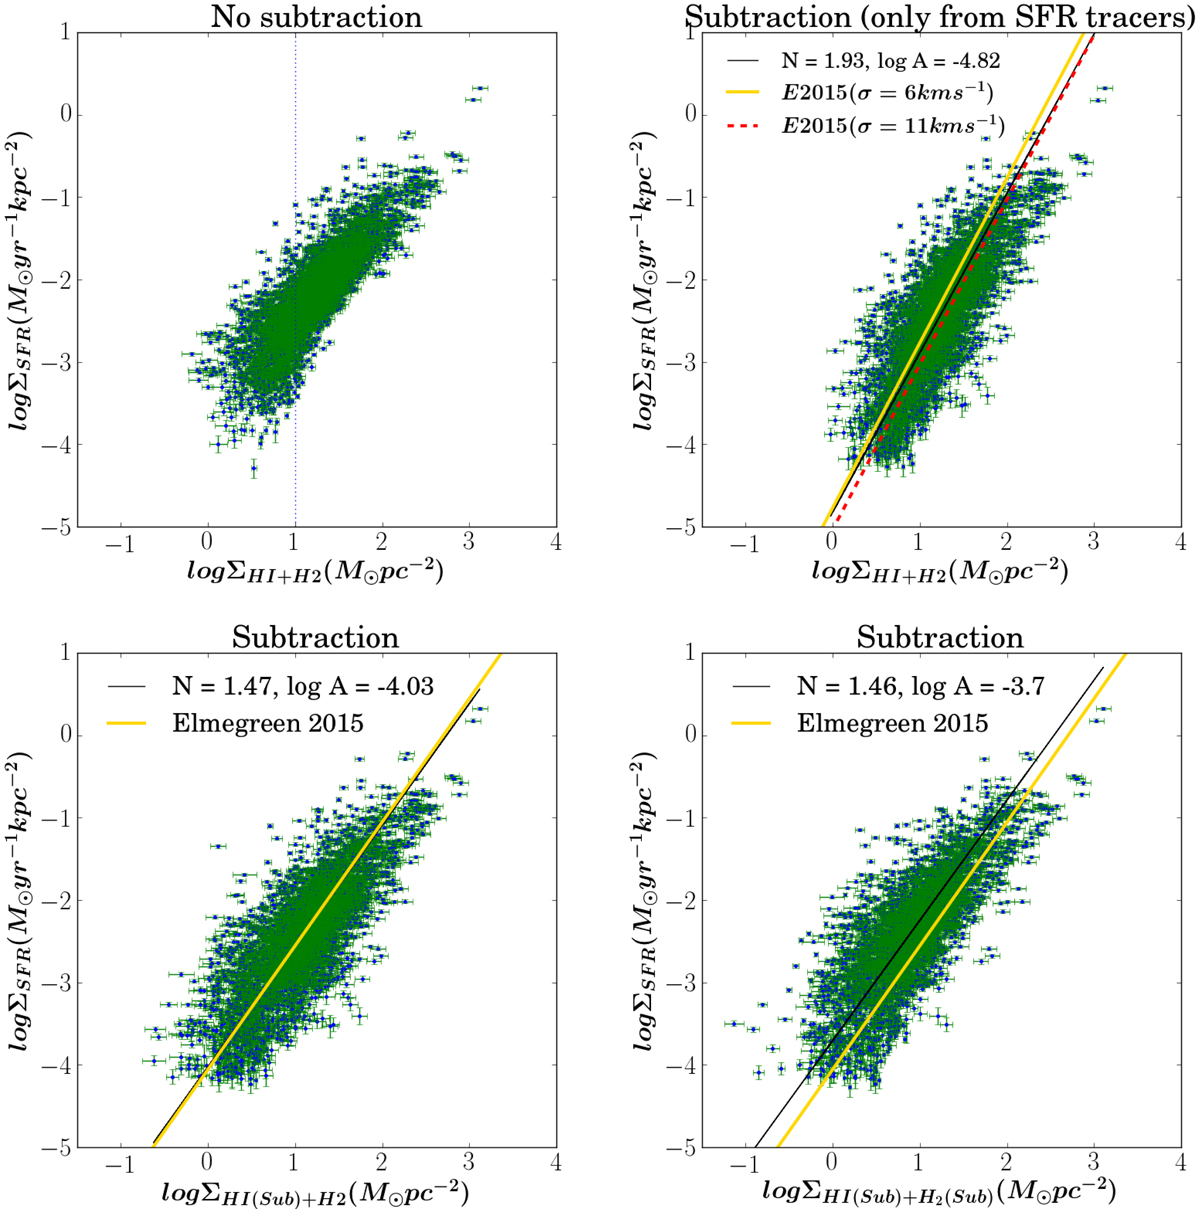
Spatially-resolved total gas Schmidt relation (ΣSFR and ΣH I+H2). In each panel, blue dots with green error bars are the spatially-resolved data, and the solid black line shows the best-fit to the spatially-resolved data for all galaxies. We have assumed a Kroupa IMF and adopted a constant X(CO) factor = 2.0 × 1020 cm−2 (K km s−1)−1. Upper-left panel: no subtraction of diffuse background is done. The vertical dotted line corresponds to 10 M⊙ pc−2 around which atomic gas surface density saturates. Upper-right panel: the diffuse background is subtracted from the SFR tracers. The solid yellow line and the dashed red line denote star-formation relation from Elmegreen 2015 (E2015) and correspond to velocity dispersion (σ) of 6 km s−1 and 11 km s−1 respectively. Lower-left panel: the diffuse background is subtracted from the SFR tracers as well as from H I. Lower-right panel: the diffuse background is subtracted from the SFR tracers, HI and CO. The solid yellow solid line on lower panels corresponds to the star-formation relation based on a dynamical model from Elmegreen (2015) obtained at a constant scale height of H = 100 pc. See text in Sect. 5.1 for further details on models.
Current usage metrics show cumulative count of Article Views (full-text article views including HTML views, PDF and ePub downloads, according to the available data) and Abstracts Views on Vision4Press platform.
Data correspond to usage on the plateform after 2015. The current usage metrics is available 48-96 hours after online publication and is updated daily on week days.
Initial download of the metrics may take a while.