Fig. 7.
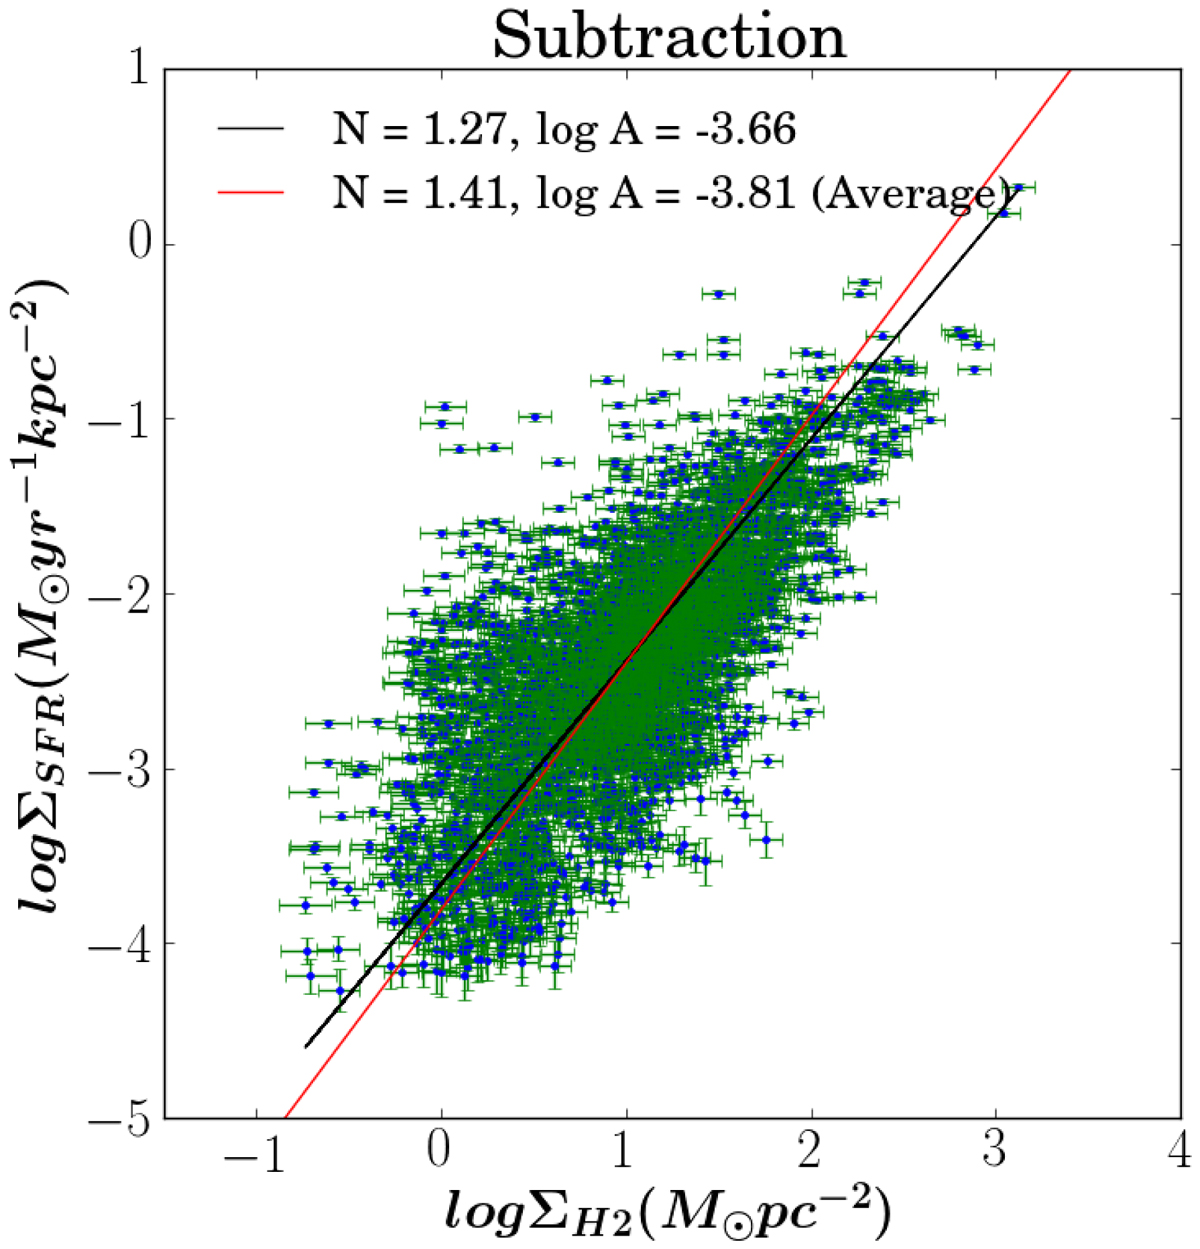
Spatially-resolved molecular gas Schmidt relation (ΣSFR versus ΣH2) for all sample galaxies, where the diffuse background has been subtracted from the SFR tracers. The red line is the fit obtained by averaging N (power-law indices) and log A (star-formation efficiencies) from individual galaxies (Table 4). The solid black line shows the best-fit to the spatially-resolved data for all galaxies. A Kroupa IMF and a constant X(CO) factor = 2.0 × 1020 cm−2 (K km s−1)−1 have been assumed.
Current usage metrics show cumulative count of Article Views (full-text article views including HTML views, PDF and ePub downloads, according to the available data) and Abstracts Views on Vision4Press platform.
Data correspond to usage on the plateform after 2015. The current usage metrics is available 48-96 hours after online publication and is updated daily on week days.
Initial download of the metrics may take a while.