Fig. 4.
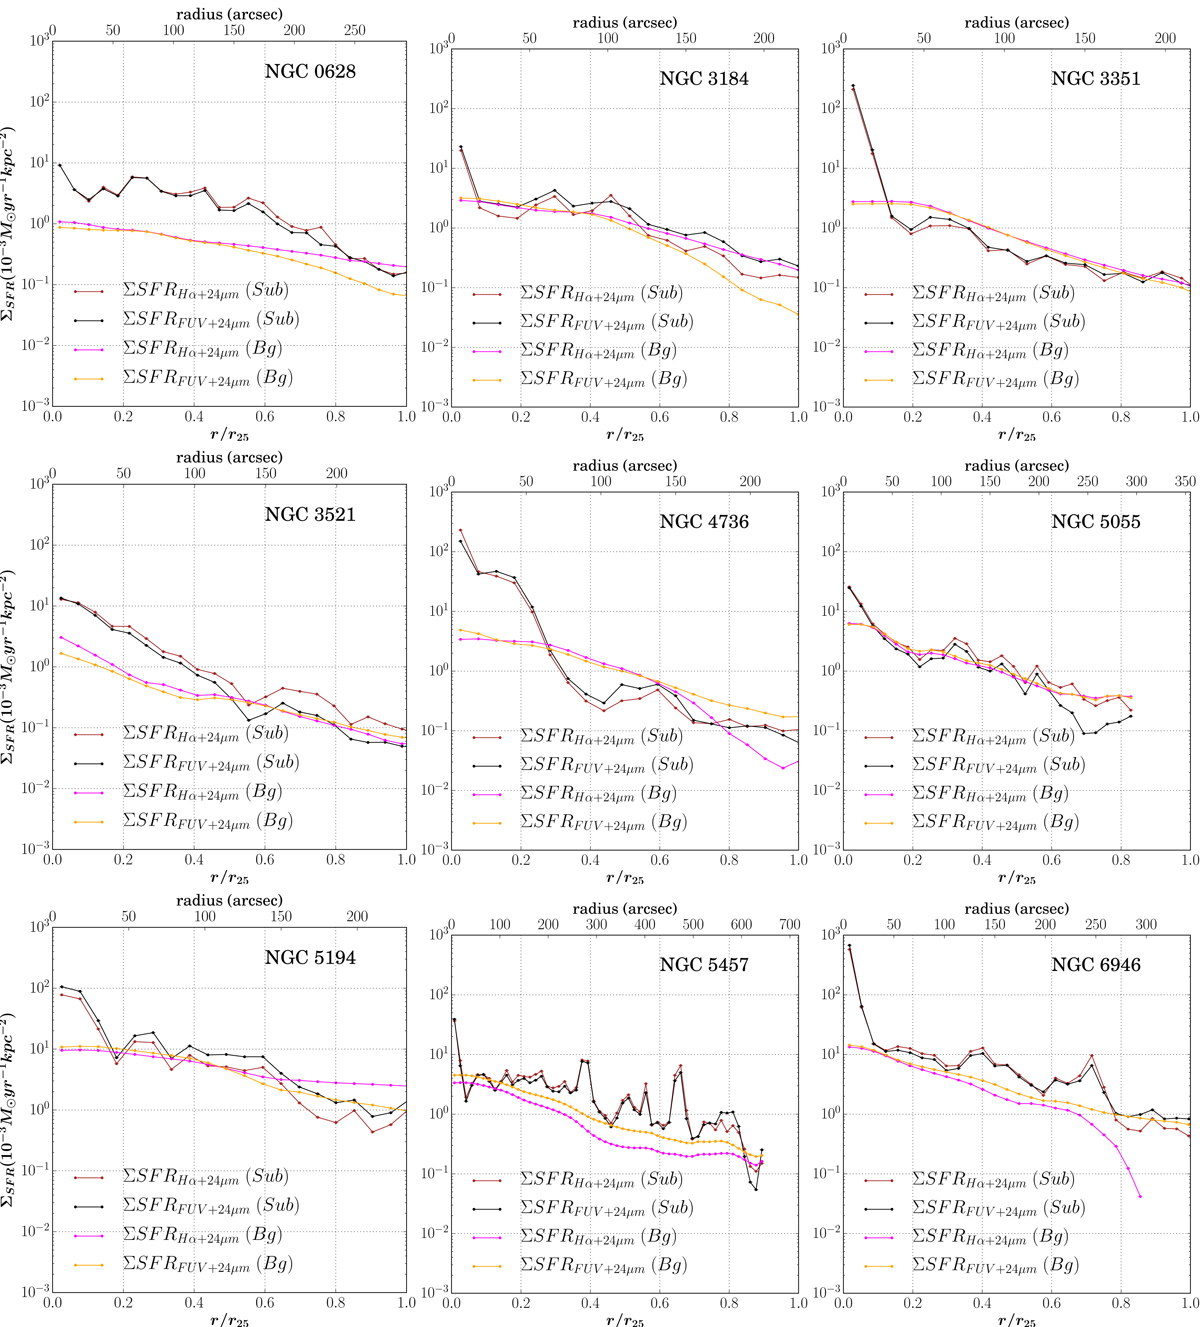
Radial profiles of ΣSFR for all nine galaxies in sample after removal of diffuse background. The x-axis presents the galactocentric radius normalised by r25 (bottom) and in arcsecs (top). The y-axis presents ΣSFR in units of 10−3 M⊙ yr−1 kpc−2 (the scaling is performed for comparison with radial plots from original unsubtracted data in Fig. D.1). The brown and black curves denote ΣSFR(Hα + 24 μm) and ΣSFR(FUV + 24 μm) respectively obtained from the data where diffuse background is subtracted from the SFR tracers. The magenta and orange curves denote ΣSFR(Hα + 24 μm) and ΣSFR(FUV + 24 μm), respectively obtained from the diffuse background maps of the SFR tracers.
Current usage metrics show cumulative count of Article Views (full-text article views including HTML views, PDF and ePub downloads, according to the available data) and Abstracts Views on Vision4Press platform.
Data correspond to usage on the plateform after 2015. The current usage metrics is available 48-96 hours after online publication and is updated daily on week days.
Initial download of the metrics may take a while.